Cookbook
This is the cookbook for using bluesky at the AXSYS-TES Beamline. Many examples and many commands are explicitly written in a form that is easy for the user/operator to simply copy and paste them into the bluesky terminal as they are or with little modification.
Preparing TES for measurments
The TES control system is running on two computers:
| hostname | IP | usage |
|---|---|---|
| tessy.exp0902.bessy.de | 173.31.133.40 | TES raw data and TES server environment |
| bluesky-exp0902.exp0902.bessy.de | 173.31.133.40 | bluesky environment (nbs-gui, queueserver) |
On bluesky-exp0902 the nbs_gui (Bluesku environment) is running to control the beamline and the experiment, tessy is used to control the TES detector and save/process the measured data.The nbs-gui is connected to the TES detector through the tes_server which needs to run on tessy.exp0902.bessy.de.
Starting the services for the experiment
Starting procedure for the tes_server:
on tessy.exp0902.bessy.de
-
start dastard, type the follwoing in a terminal:
bash dastard -
start the
tes_server, for this you can use a small GUI, in an other terminal type the following:bash tes_gui -
A small GUI with 3 buttons will open, click on
Start all TES, this will opendcomand start thetes_server(a caproto IOC).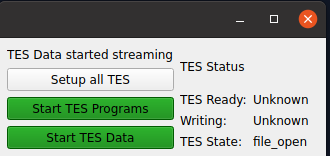
When everything went good, the last two buttons should become green, if not check the terminal for
dastardandtes_guiit should show errors. -
A
dastar dcommanderwindo will open, cahnge to the tabnew triggeringand click onSendonce in thePulse trigger settingsbox.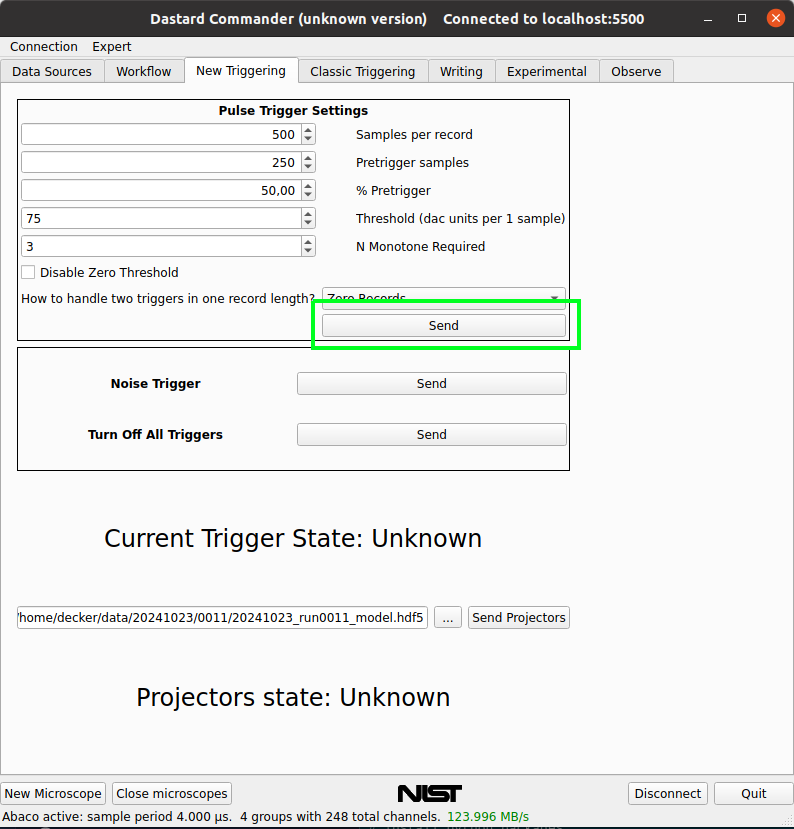
-
When you change to the
Observetab you should see some count coming in.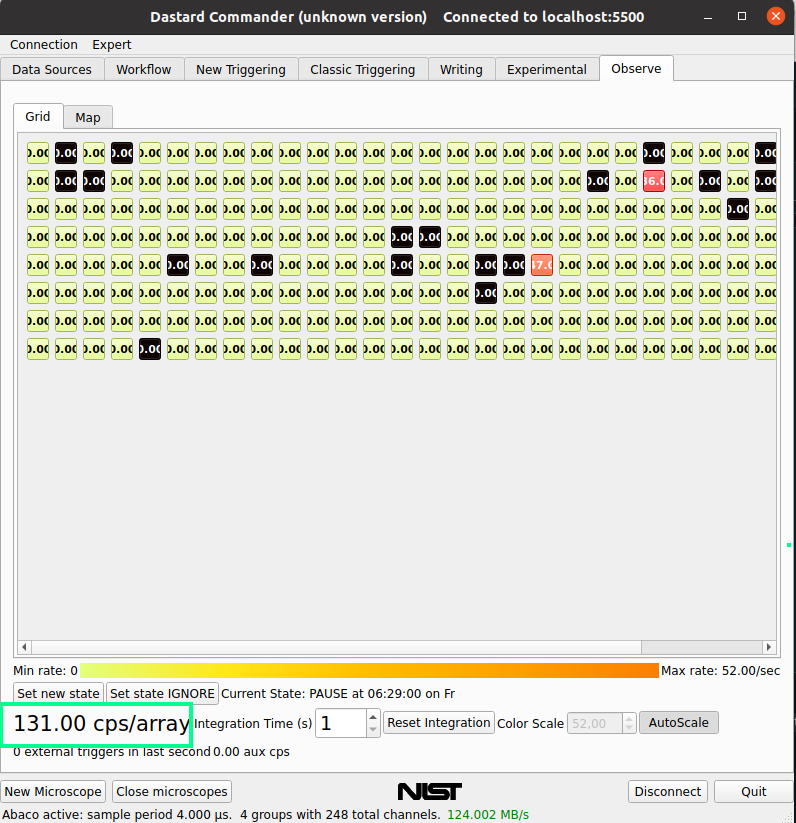
on bluesky-exp0902.exp0902.bessy.de
Normally nothing need to be done, since the nbs-gui and a docker container tes_caproto (this one start automaticlly on boot) should handle everything for you.
At the moment ther is a issue in the connection to the TES detector, so every time you restart dastard you need to activate off-file writing again (somehow it fails to activate automatic).
In the nbs-gui go to the ipython console tab (see Connect to the ipython console) and type:
tes.rcp.write_off(True)
This should ber fixe in the future, sorry.
Start bluesky GUI
The GUI to control the experiment is nbs-gui, it can be started by typing this line in a terminal:
nbs-gui-start
This GUI uses bluesky queueserver, queueserver is automatically started in a docker container on the boot and should be always running.
Connect the nbs-gui to the queueserver by click on connect on the Queue Server Box. When the connection process is done open the
environment by click on open. Should it not open zou can find the issue in the log on the Queue Control tab.
When everything worked the head of your Queue Control should looks like this:
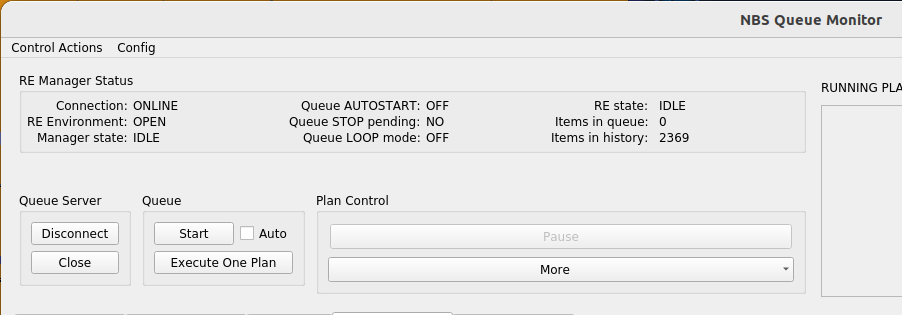
You are now connected to the bluesky environment of the queueserever were all need actions for the experiment can be started.
TES calibration
Before a scan or any measurment is take you need to run a calibration for the TES. This calbration is save in the same directory as the measurments data it belongs to.
To start the calibration go to TES Control Tab and do the followong steps:
- close the beam shutter and click on
Take noise - open the beam shutter again and click on
Take Projectors - Click on
Make and Send Projectors
Now you can run a TES calibrate plan in Queue Control tab >> Plan Widgets.
Here you can choose calibration lines, which will be use to proocess the calibation data in autoprocessing, the energy and the duration for the calibration.
Running plans with GUI
Predefined plans for axsystes can be run in Queue Control tab >> Plan Widgets you can run the follwoing plan from nbs-gui:
| plan name | description |
|---|---|
| TES Calibrate | TES detector calibration, noise and projectore need to be done before |
| move | move to apature or sgm |
| scan | run a scan plan |
| timescan | run a timed scan |
| XAS | run a XAS scan |
In this tab plan can be queued, so the plans are started by the queueserver in a certain order. The queue can be manipulated, started and stop by the queue controls on the top.
The raw data for each run plan are saved together with the last calibration in teh data directory or on qumulo-data, since the calibration is needed to process this data.
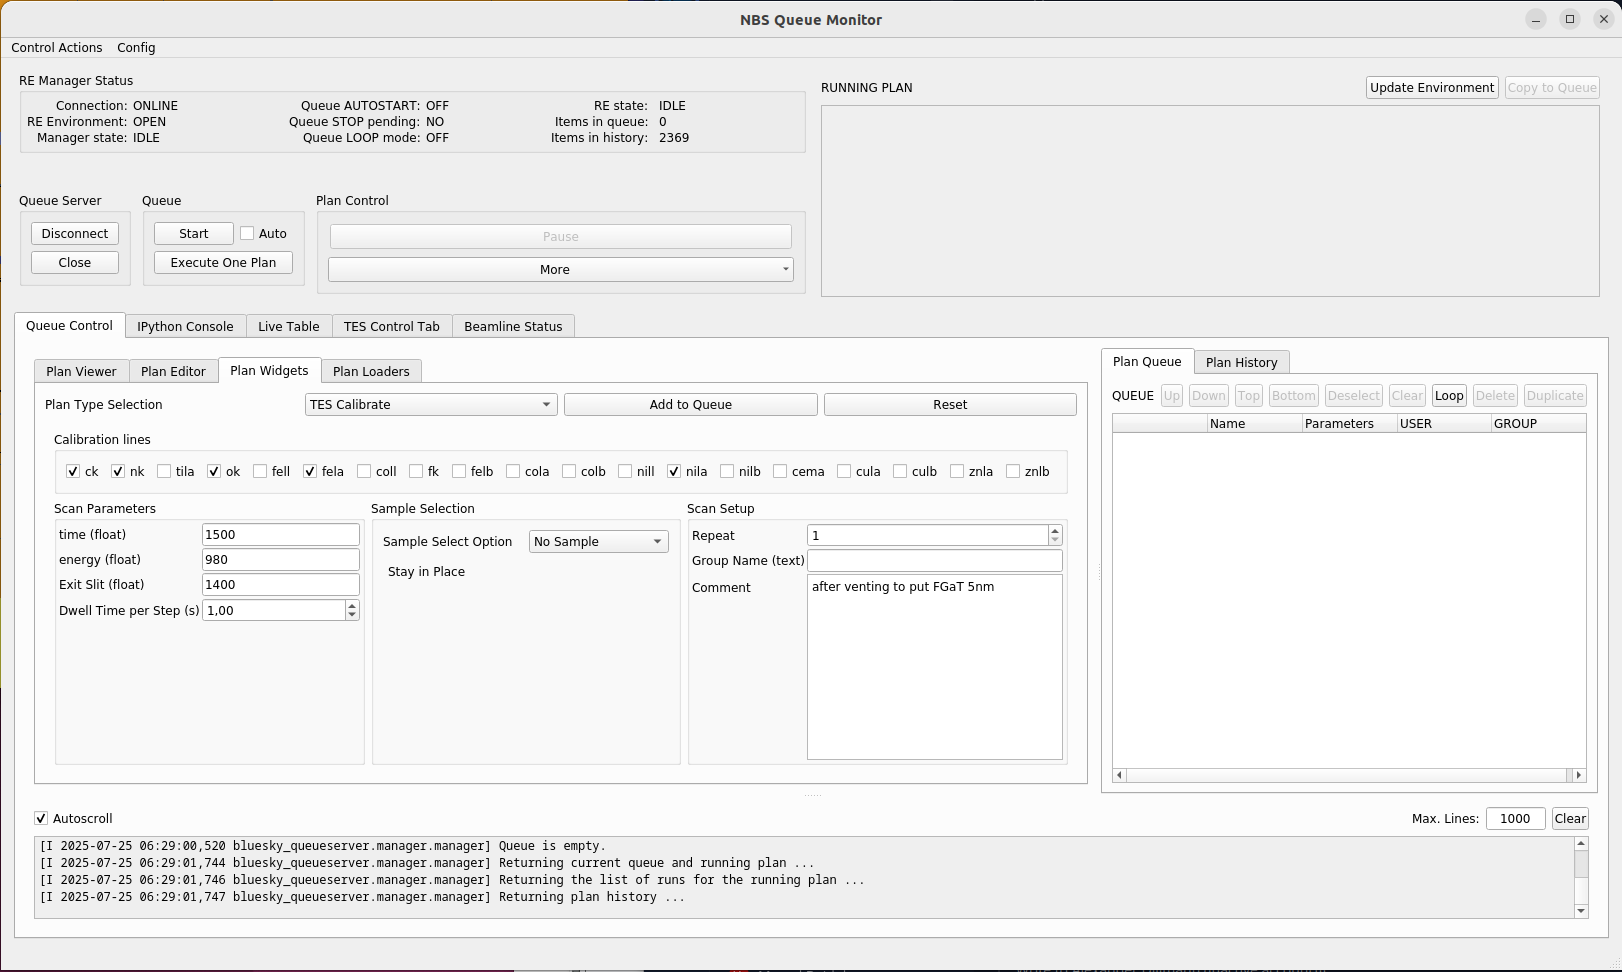
Choosse a plan fill in the parameter press Submit to add the plan to the queue, press Start at the Queue groub on the right to start the queue. On the
Queue Control you can see which plan is correntlu executed.
Connect to the ipython console
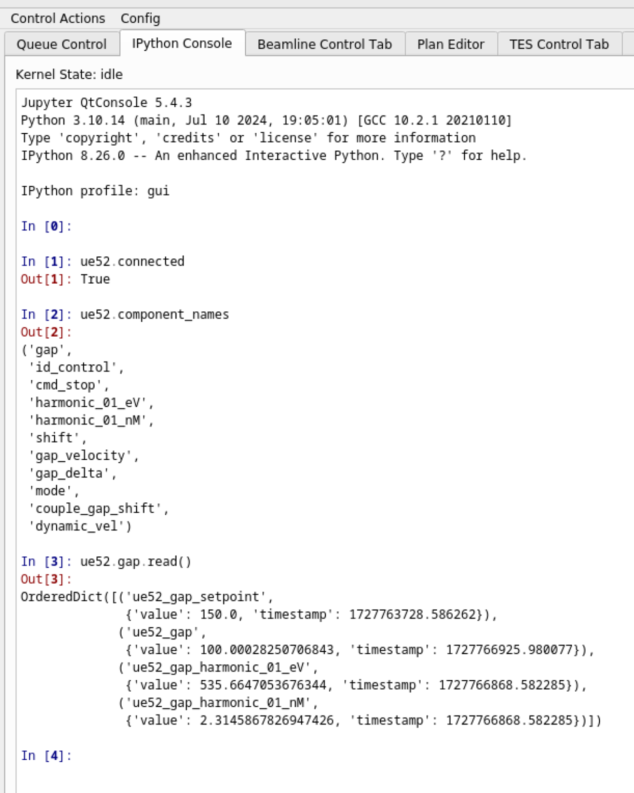
On the IPython Console tab of the GUI you can connect to the RE and use the ipython console to controle bluesky.
Switch to the IPython Console tab and click the Connect to Kernel button, for this the environment of the queueserver needs to be open (see Start bluesky GUI section).
An open ipython console looks like this, you can use the usual bluesky commands:
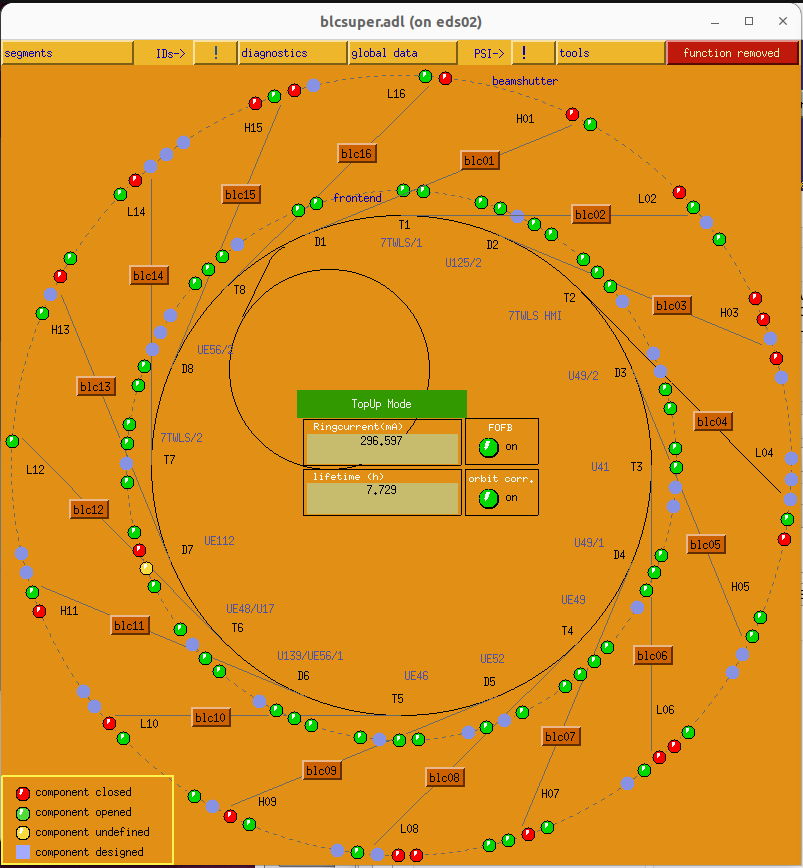
Open Bluepanels on the bluesky computer
You can opne the typical bessyii bluepanels on the bluesky computer by using the terminal:
bluepanels_start
It should looks like this:
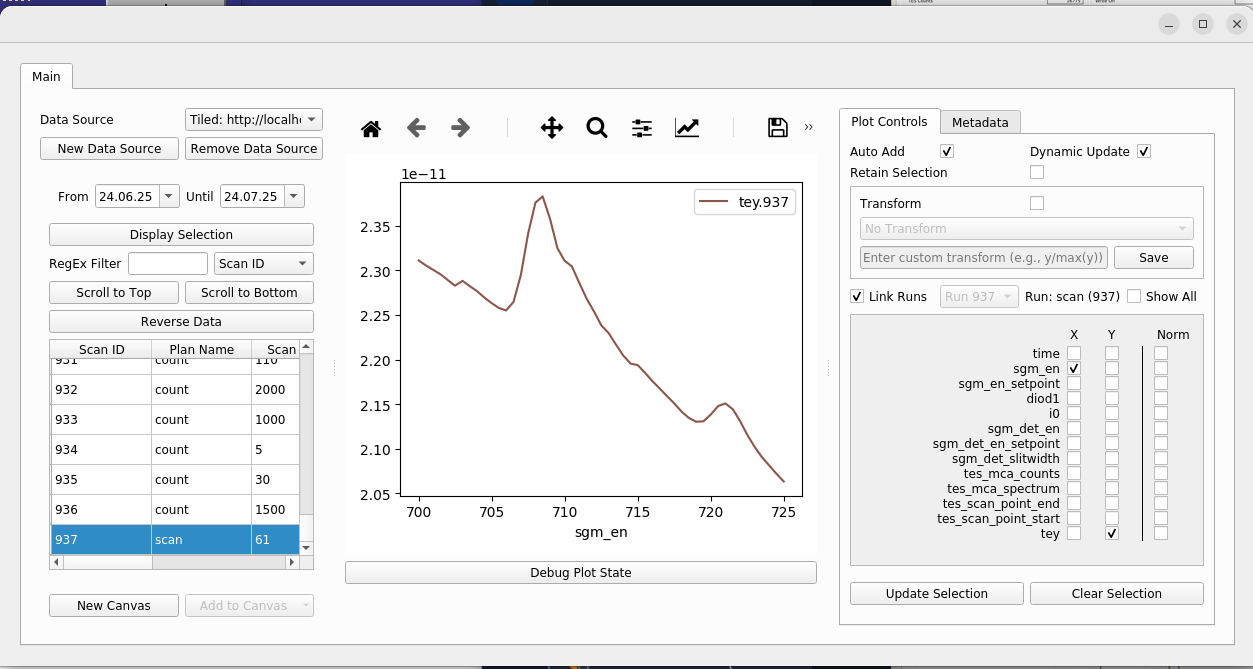
Data visialisation with nbs-viewer
To look into measure data (unprocessed) during the experimnent youi can use nbs-viewer, to start it type the following into the terminal:
nbs-viewer
Click on New Data Source to connect to the tiled service (default its: http://localhost:8000). Choose the time peroide for the data you want to be displayed and click on Display Selection.
Select the scan_id on the left you would like to plot data from. On the right side you can check wich data should be ploted.