OAESE
This is the cookbook for using bluesky at the OAESE Experiment. Follow this guide in order to bring everything back if the machine is turned off.
Data
Data is saved on at /home/oaese_user/bluesky/data. In this directory data is saved as CSV and as spec files.
data from EC-Lab is saved under /home/oaese_user/bluesky/data/biologic. This directory is available from EC-Lab under the Z: drive
Starting EC-Lab
EC Lab is running on a windows VM inside a virtualbox on this Ubuntu Host
You can start it with the icon at the top right of the Desktop.
Starting PyMca
from a terminal write
pymca
or use the icon on the desktop
Start the Bluesky Service
from a terminal write
qserver_start
You must do this step before starting the GUI
Start Bluesky GUI
from a terminal write
bluesky_gui
Creating Experiment Dataset
Your data is saved in folders named after your experiment and measurements within those. There is a tab in the GUI for configuring this called "Data Structure".
Enter the name of your experiment which will create the top level directory for storing the data your produce. You can then create any number of sub directories for sample or other studies under that.
When you make a new dataset/experiment the scan_id is automatically reset to 0.
/home/oaese_user/bluesky/data
|
|___2024-12-03_experiment_name/
    |
    |---2024-12-03_dataset_1/
    |   |
    |   |---2024-12-03_dataset_1.spec
    |   |---mca
    |       |___2024-12-03_dataset_1_{scan_id}_{event_num}.h5
    |
    |---2024-12-03_dataset_2/
        |
        |---2024-12-03_dataset_2.spec
        |---mca
            |___2024-12-03_dataset_2_{scan_id}_{event_num}.h5
Connect GUI to the Bluesky Service
You must connect the GUI to the Bluesky Server.
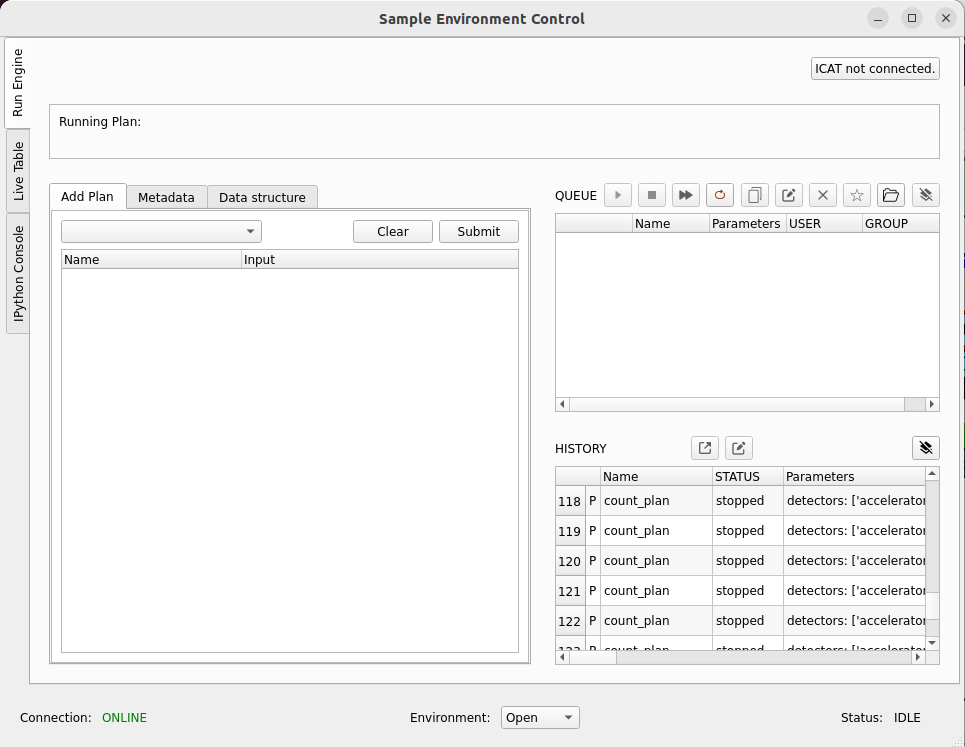
Press the drop down menu which says "close", select "open"

After a short time (20 seconds) the display will look like this

You can now add plans
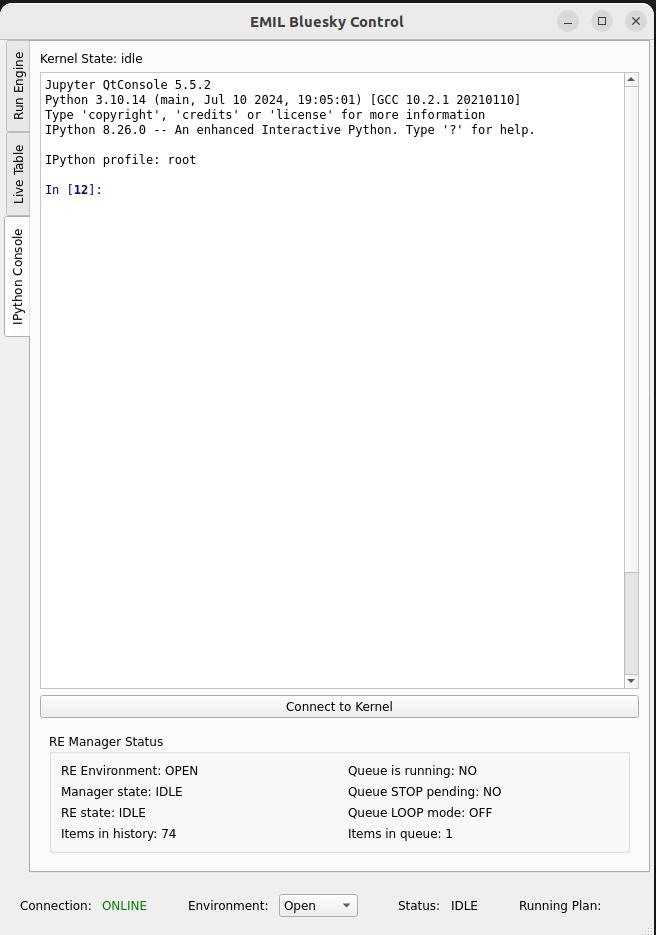
Connecting to the IPython Kernel
Once the GUI is connected to the qserver you can connect to the IPython Kernel
Press the button "connect to Kernel"
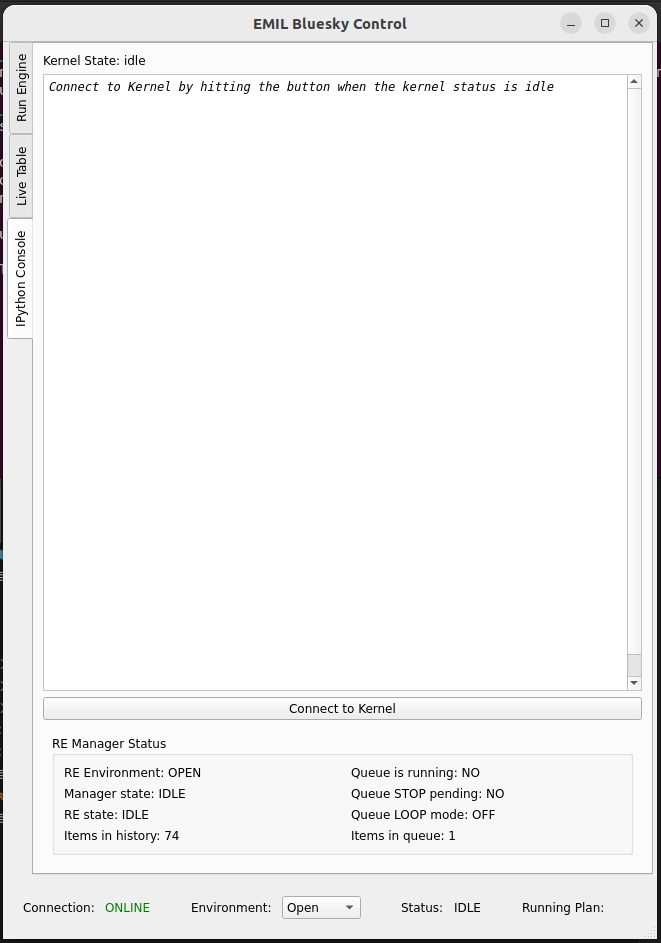
It will look like this when connected:
Adding plans to the Queue
On the left side of the screen is a window that allows you to configure various plans. The drop down menu gives a list of all available plans.
You can enter the parameters you need, then press "Submit" the plan will then be added to the queue. You can keep pressing submit and it will be repeated.
Controlling the Queue
There are a number of buttons at the top of the queue. Here is what each one does, in the order it appears.
| Name | Function | Enabled When |
|---|---|---|
| Play | Start the queue if it is not running, or resume a plan if it is paused | The environment is open and there is a plan in the queue or paused. |
| Pause | Pause a plan at the next possible moment if it is running. If a motor (e.g DCM) is moving, it will wait until the move is finished. For a long move (e.g. change from 9KeV to 18 KeV) this might take 12 mins. Please be patient, it's not just software | A plan is running |
| Stop | Request that the queue stops after the next plan has ended. | A plan is running |
| Skip | Pause the current plan, stop the RE, then move to the next item in the queue. | A plan is running |
| Loop | Request that the queue runs in loop mode. Plans that have finished executing will be returned to the back of the queue. It will keep looping until you stop the queue | A plan is running |
| Copy | Duplicate selected items in the queue | Always |
| Edit | Copy the contents of a selected plan to the plan editor and remove this item from the queue. Pressing submit again will put it back where it was. | Always |
| Delete | Remove a selected item from the queue | Always |
| Batch | Save the selected set of plans as a named batch | Always |
| Load | Load a batch of plans from a file | Always |
| Clear | Clear the plans from the queue | Always |
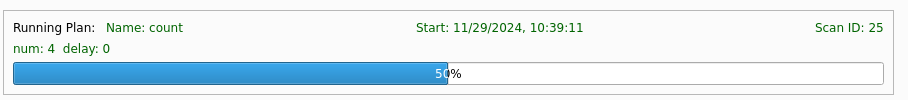
Monitoring the Running Plan
The box above the plan editor and the queue control widget allows you to monitor the currently running plan. The start time is shown along with the plan name and arguments.
Viewing the RunEngine Terminal
The Queserver allows us to submit plans to the RunEngine. Currently the best way of monitoring this is from a terminal
open a terminal and type
bluesky_monitor
You will see the logs of the queueserver
Devices
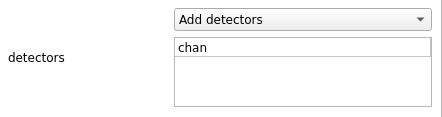
When including devices in the detector list you can choose from the following
| Name | Description |
|---|---|
i0_mirror_current_u17 |
kth25 connected to M4 UE48 |
i0_mirror_current_ue48 |
kth20 connected to M4 UE48 |
i0_gold_mesh |
Not Connected |
tfy_channeltron |
OAESE Channeltron |
tfy_photodiode |
OAESE KTH00. OAESE TFY Photodiode |
beam_flux_diode |
OAESE KTH01. Photodiode on a swing arm to look at the full beam. Used for normalisation |
pfy_bruker_mca |
Bruker Multi Channel Analyser |
u17_dcm.en |
u17 DCM |
ue48_pgm.en |
UE48 PGM |
What out, there is a bug.... selecting pfy_bruker will not work you must use pfy_bruker_mca
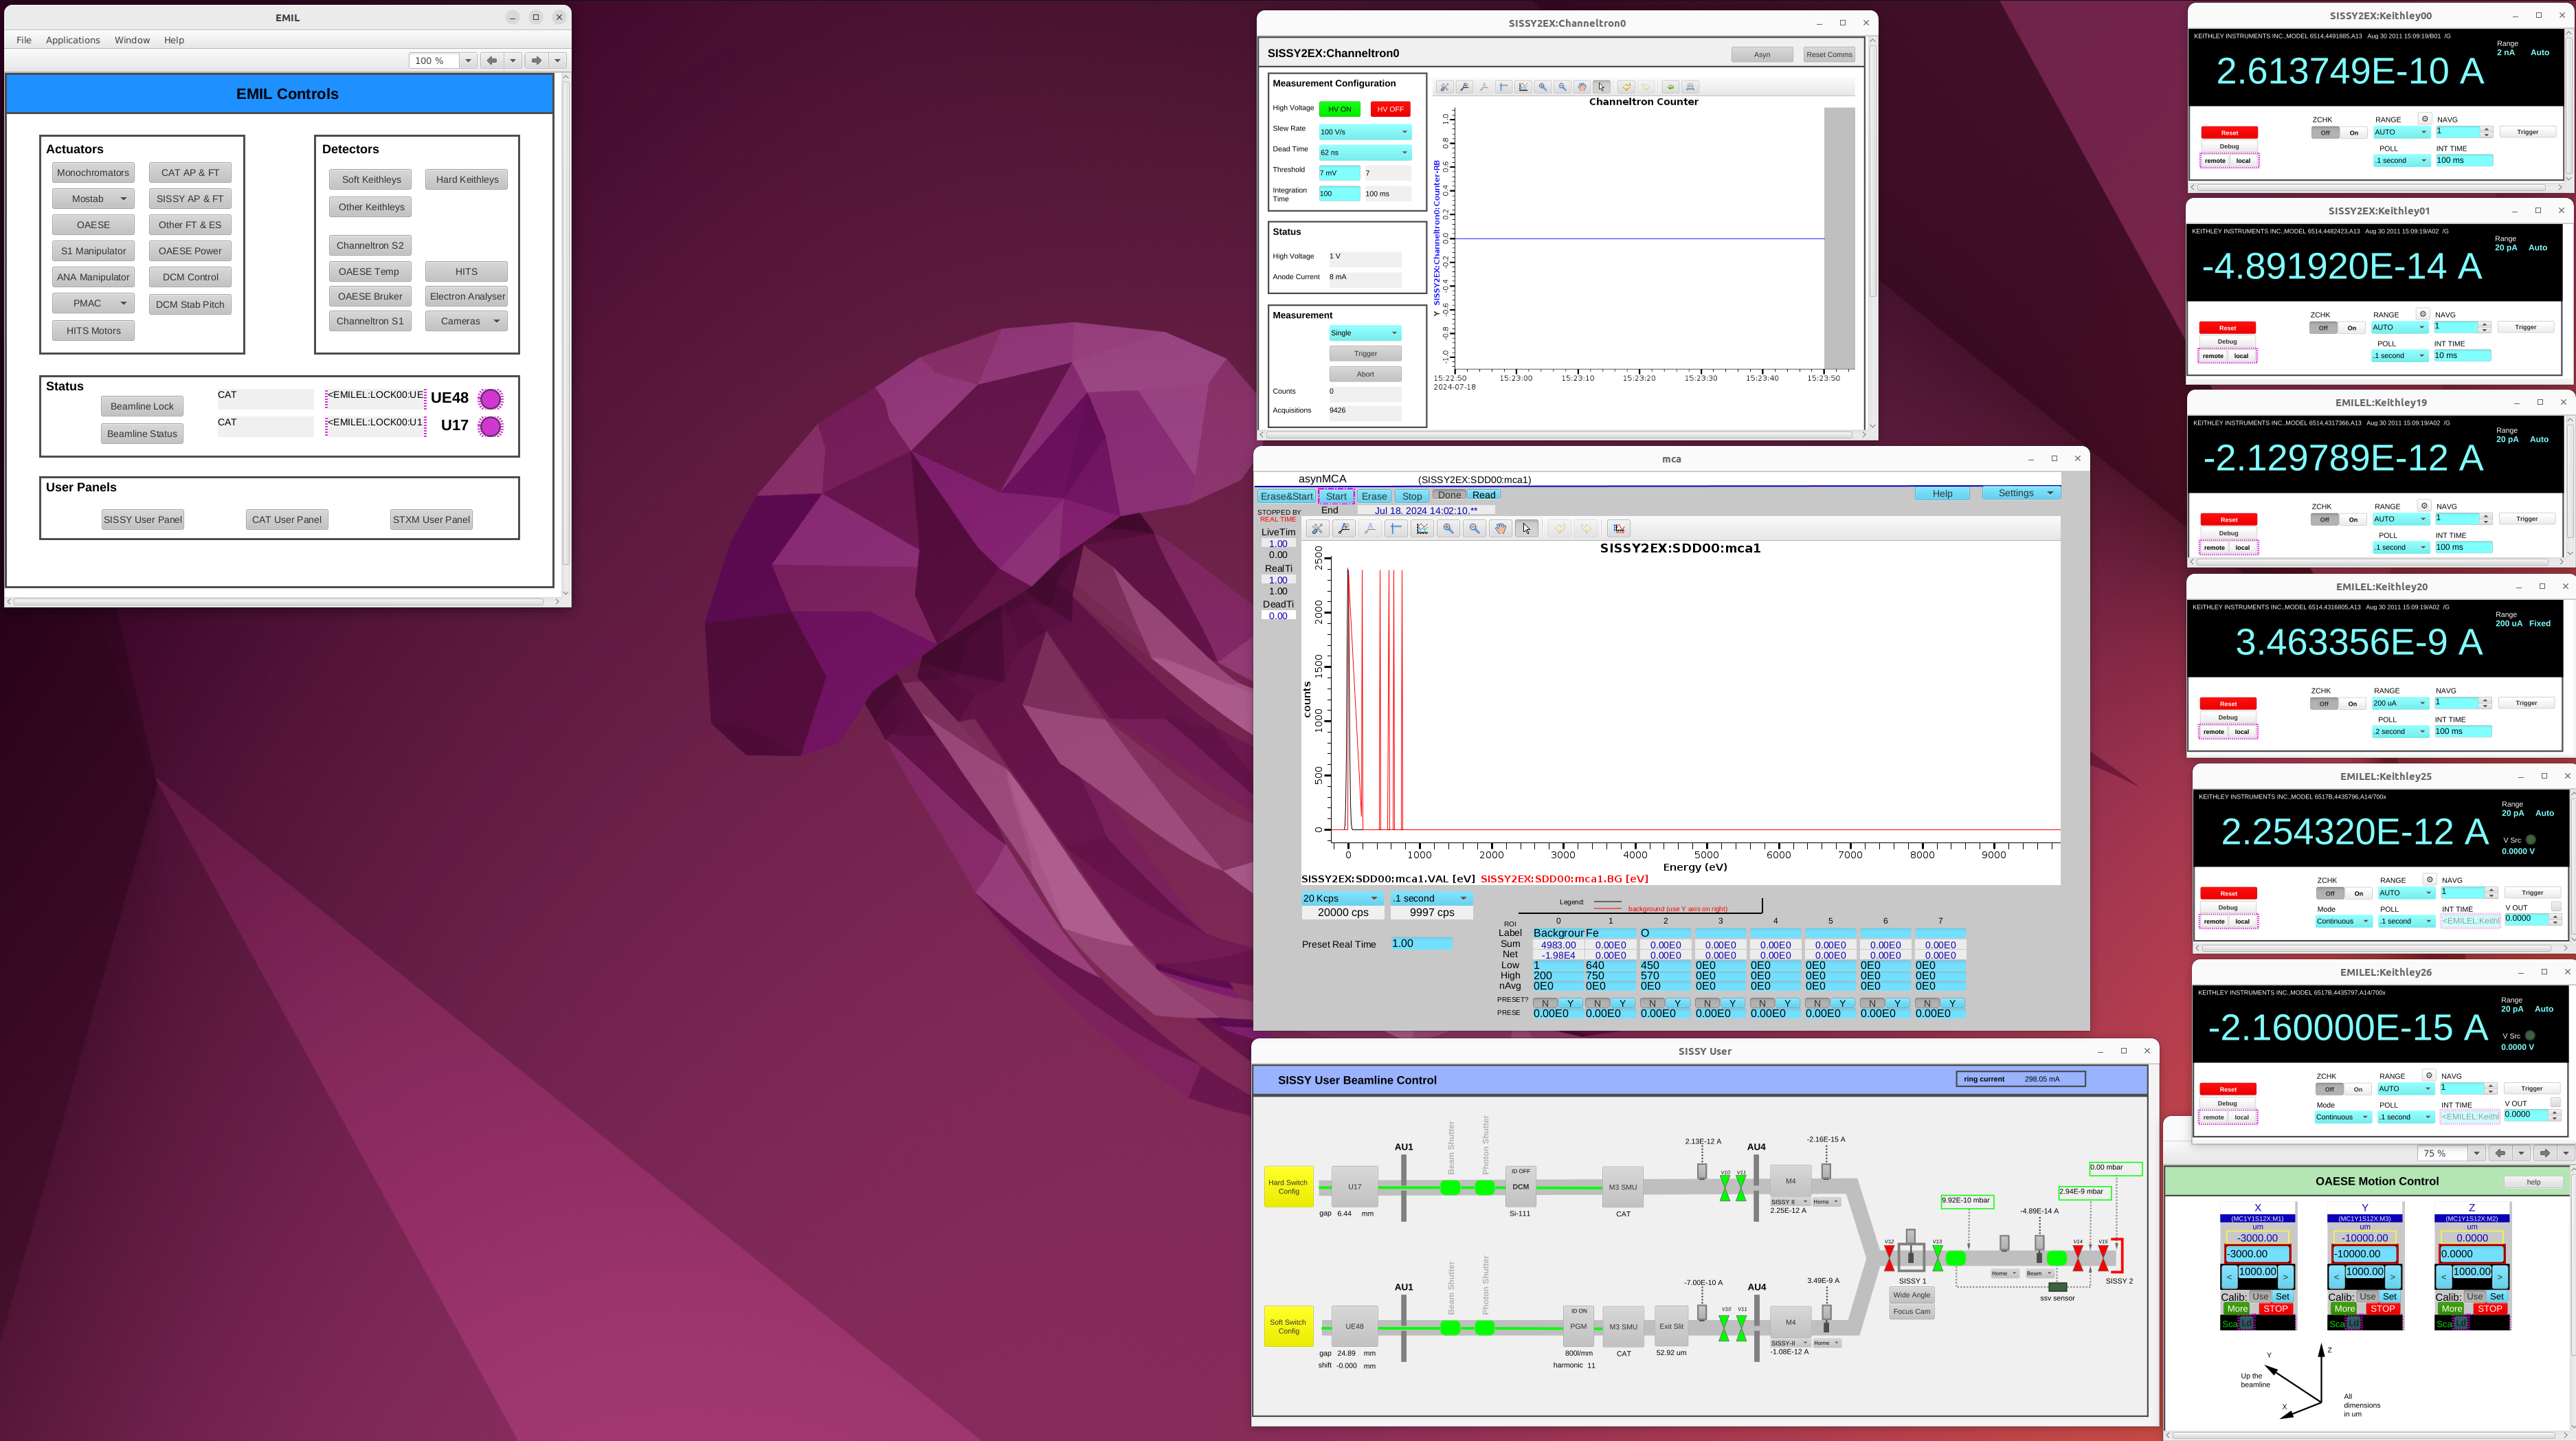
Starting Phoebus Beamline Panles
From a terminal write
phoebus_start
This will open all of the phoebus panels for the beamline.
The Channeltron
tfy_channeltron
The channeltron is a device which is sensitive to photons. It is operating in negative bias mode.
To use it you must first turn on the HV. When you are done turn off the HV to protect the device and prevent it ageing.
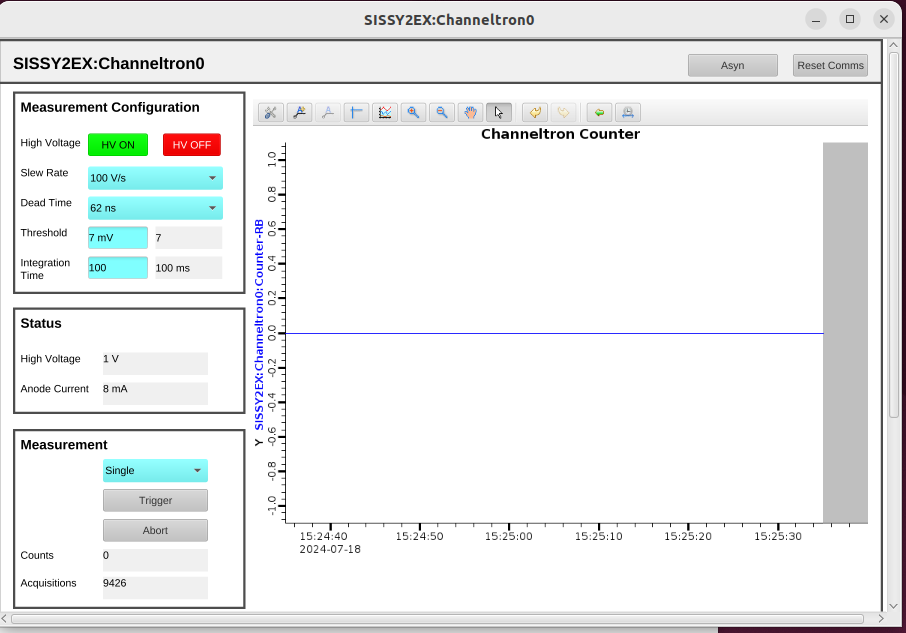
The device can be run in mode "Single" or "Continuous". Continuous mode is useful to run without bluesky to see if you are getting any signal, but it is noisy.
During measurements, Bluesky will set it in "Single" mode.
To add the device to a bluesky plan, use the name tfy_channeltron
Finding the HV Working Voltage
For background see http://www.sjuts.com/Quality_Gain.html
Calling the plan commission_channeltron_hv will scan the HV of the channeltron while measureing counts. As long as either the U17 or UE48 beam is on, you should see some signal
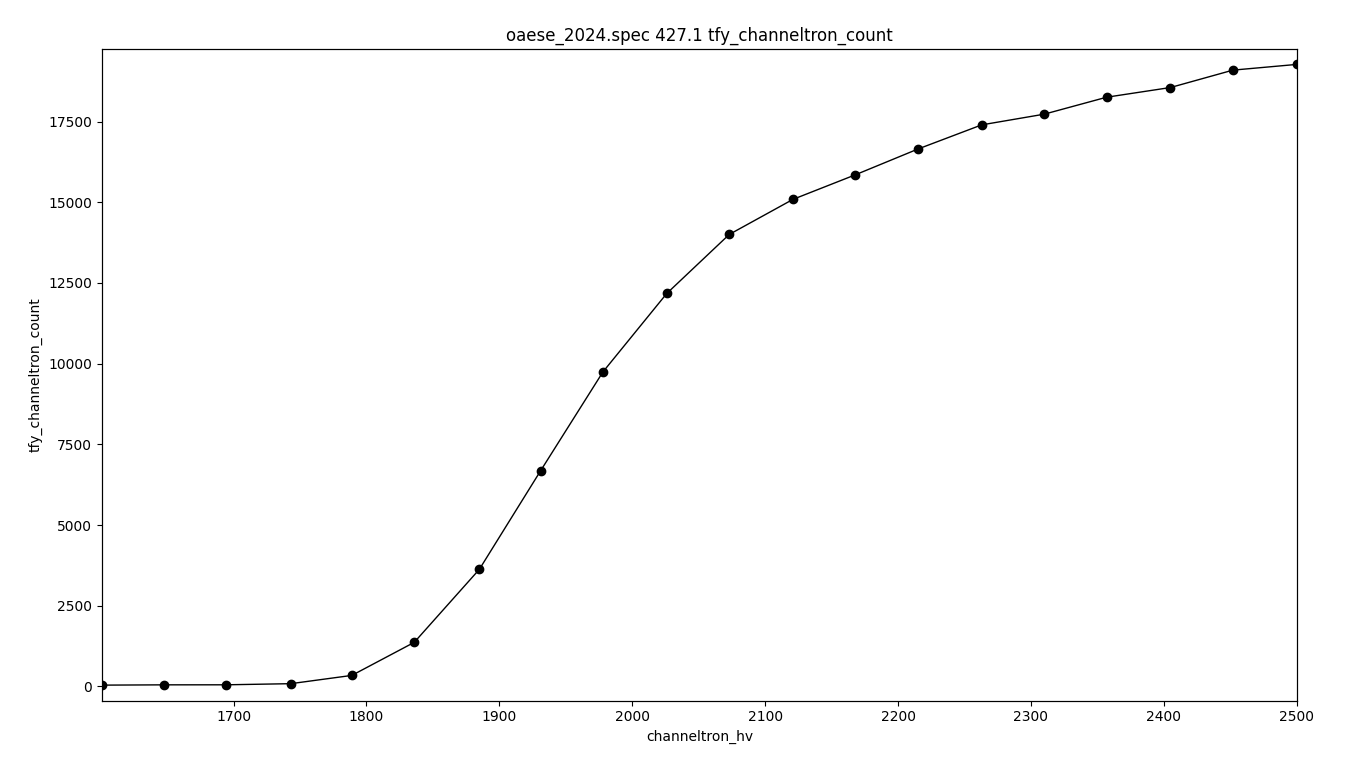
After performing this scan you can make a judgement about where to set the HV by looking at the voltage at which the rate of change of counts starts to decrease. Only the beamline scientist or your local contact can make this change.
The Bruker SDD
pfy_bruker_mca
The Bruker Silicon Drift Detector (SDD) is a detector which allows us to perform PFY measurements. It is known as an MCA (Multi Channel Analyser)
You can name regions of interest and define their start and stop energies in the phobeus panel.
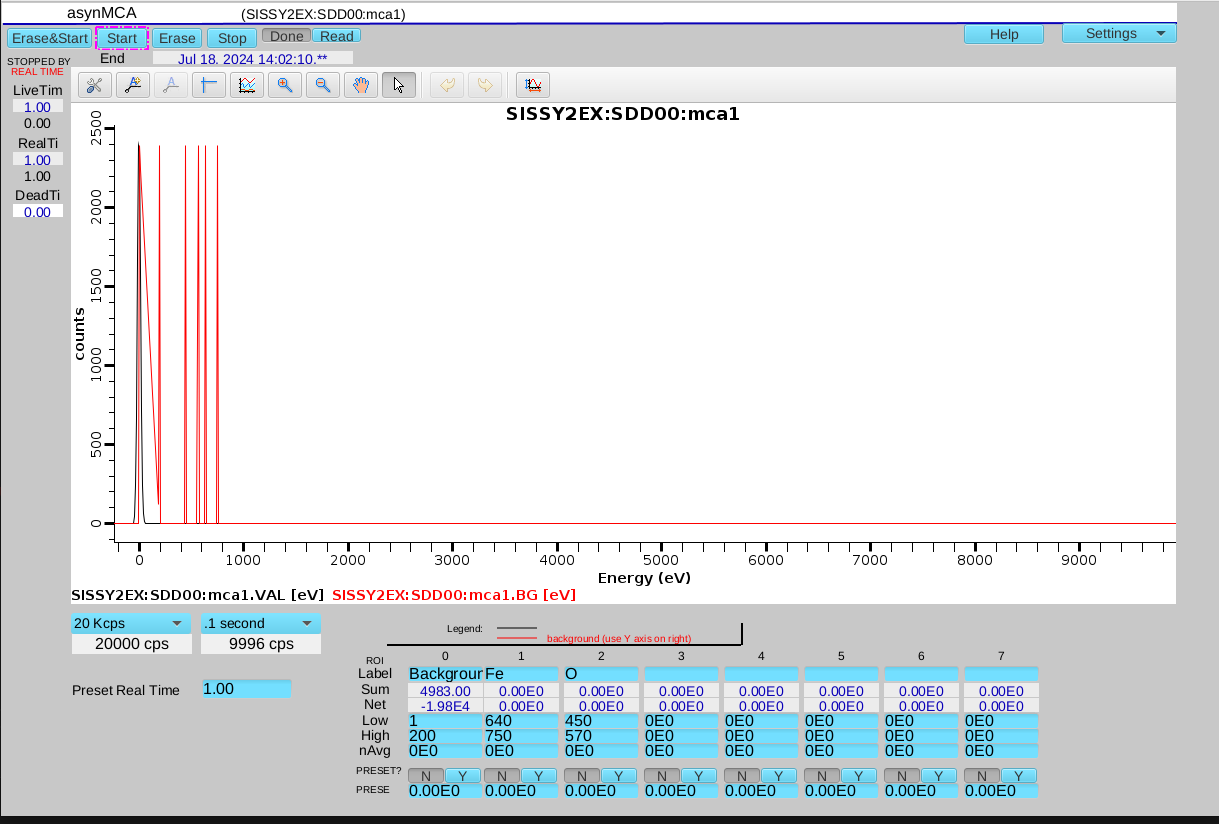
To change what is plotted live enter in the IPython Kernel
pfy_bruker_mca.roi0.display()
or
pfy_bruker_mca.roi0.hide()
If you trigger the device by hand, you must first select "Passive". The Bluesky plan will do this for you
Remote Power Supply
There is a remote power supply. It is connected to syringe pumps and other devices. You can access this from firefox
http://172.31.182.36/ov.html?
Current Monitoring
There are various currents measured with Keithley Electrometers of different types.
You can set the integration time on most Keithleys in ms. The U17 Keithley integration time is set in NPLC (number of Power Line Cycles. Each NPLC is 20ms)
Plans
sample_map
This will scan the x and z motors of the end station chamber
snake will snake the axes
https://nsls-ii.github.io/bluesky/generated/bluesky.plans.grid_scan.html#bluesky.plans.grid_scan
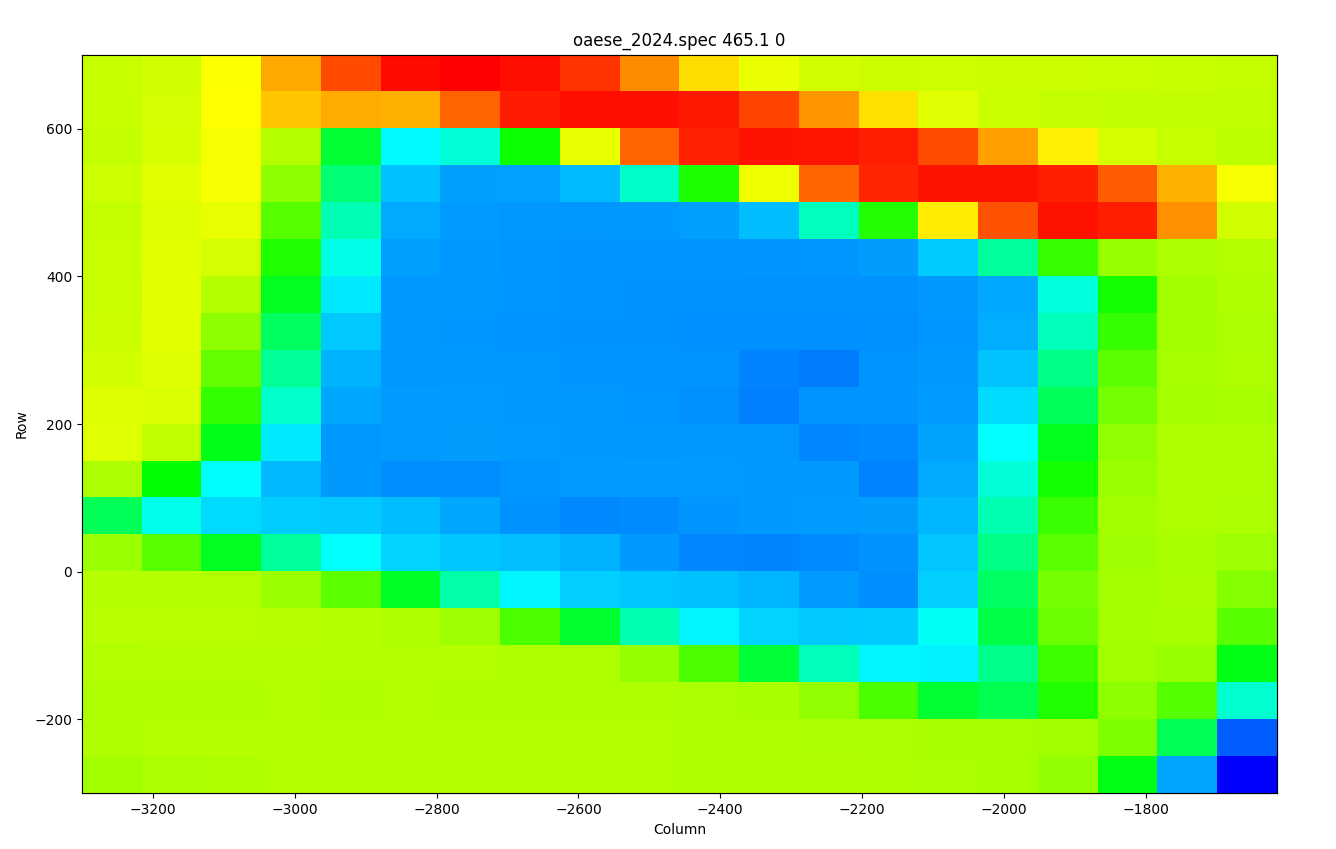
rows: x motor (horizontal) colums: z motor (vertical)
set_integration_time
This plan will set the integration time of all detectors.
Keithleys cannot have an integration time higher than 200ms
rel_move
Move a motor relative to it's current position. Wait for it to complete
move
Move a motor to a new absolute position. Wait for it to complete, or not.
open_v12 and close_v12
open and close valve 12
