MySpot Experiment
Configuration Gas System
The sample environment gas system has a number of mass flow controllers. Each one is connected to a particular gas. It is possible to mix these gasses together to make new "process" gasses.
We can define these process gasses here in this file /home/myspot/bluesky/beamlinetools/beamlinetools/beamline_config/gas_system.yaml
If you make changes to this file, you will have to restart the RE in order for them to take effect. Here is an example:
# use only numbers, letters and underscores no !/%^& etc!
mass_flow_controllers:
  mass_flow_controller1: 'He'
  mass_flow_controller2: 'H2'
  mass_flow_controller3: 'CO'

# flow rate of mass flow controllers for various process gasses 'mln/min'
# check the limits of the flow rates for each controller! We are not checking yet when you add it to the queue :(
# mfc1_limits: 350 mln/min
# mfc2_limits: 35 mln/min
# mfc3_limits: 3.5 mln/min
process_gasses:
  Inert : [30,0,0]
  H2 : [0,10,0]
  CO : [0,0,1]
Control Scheme
There are two different processes that run independently. One controls the sample environment and the other the beamline. The sample environemnt is stepping through stages of a sample environment plan. In each stage it sends plans to the beamline to perform various measurements.
The sample environment process has authority over the beamline. If the sample environment is stopped or paused, then the beamline is also stopped or paused. The reverse is not true, the beamline can be stopped or paused without affecting the sample environment process.
Only dwell, dwell during, ramp and set pressure should be run in the sample environment.
All beamline plans, alignment etc should be performed in the beamline control.

Two Queues
This scheme is achieved with two bluesky queueservers. They currently point to the same configuration files (called beamlinetools)
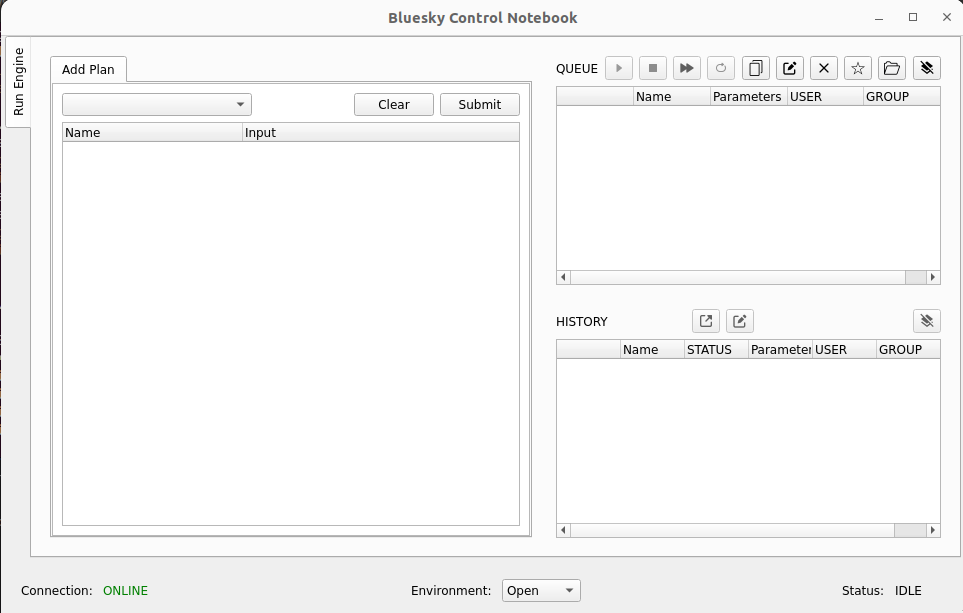
Starting the GUI
There are two GUI's that look almost the same. One is connected to a queuserver which is mainly for handling the sample environment, the other is for the beamline. We will call these primary and secondary since the primary has authority over the secondary.
To start these, assuming the two queuservers are running you can open a terminal and type:
bluesky_gui_primary
or
bluesky_gui_secondary
They look identical except for a different title "Sample Environment" and "Beamline Control". You can distinguish between them by right clicking at the bottom to choose a colour.
If it is not already running, you will need to open the environment. Press the button at the bottom of the panel.
Creating a new experiment
Your data is saved in folders named after your experiment and measurements within those. There is a tab in the GUI for configuring this called "Data Structure".
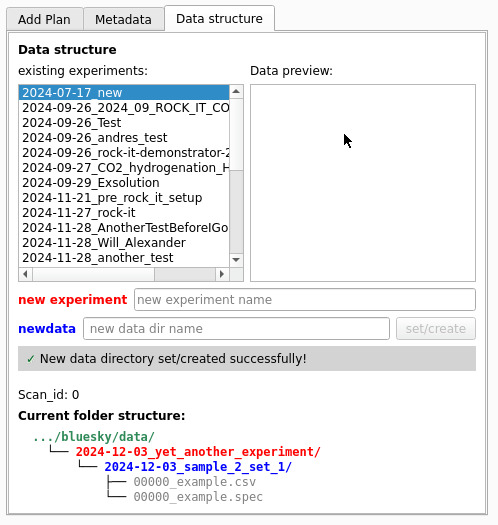
Enter the name of your experiment which will create the top level directory for storing the data your produce. You can then create any number of sub directories for sample or other studies under that.
When you make a new dataset/experiment the scan_id is automatically reset to 0.
/home/myspot/bluesky/data/
|
|___2024-12-03_experiment_name/
    |
    |---2024-12-03_dataset_1/
    |   |
    |   |---2024-12-03_dataset_1.spec
    |   |---mca
    |       |___2024-12-03_dataset_1_{scan_id}_{event_num}.h5
    |
    |---2024-12-03_dataset_2/
        |
        |---2024-12-03_dataset_2.spec
        |---mca
            |___2024-12-03_dataset_2_{scan_id}_{event_num}.h5
Adding plans to the Queue
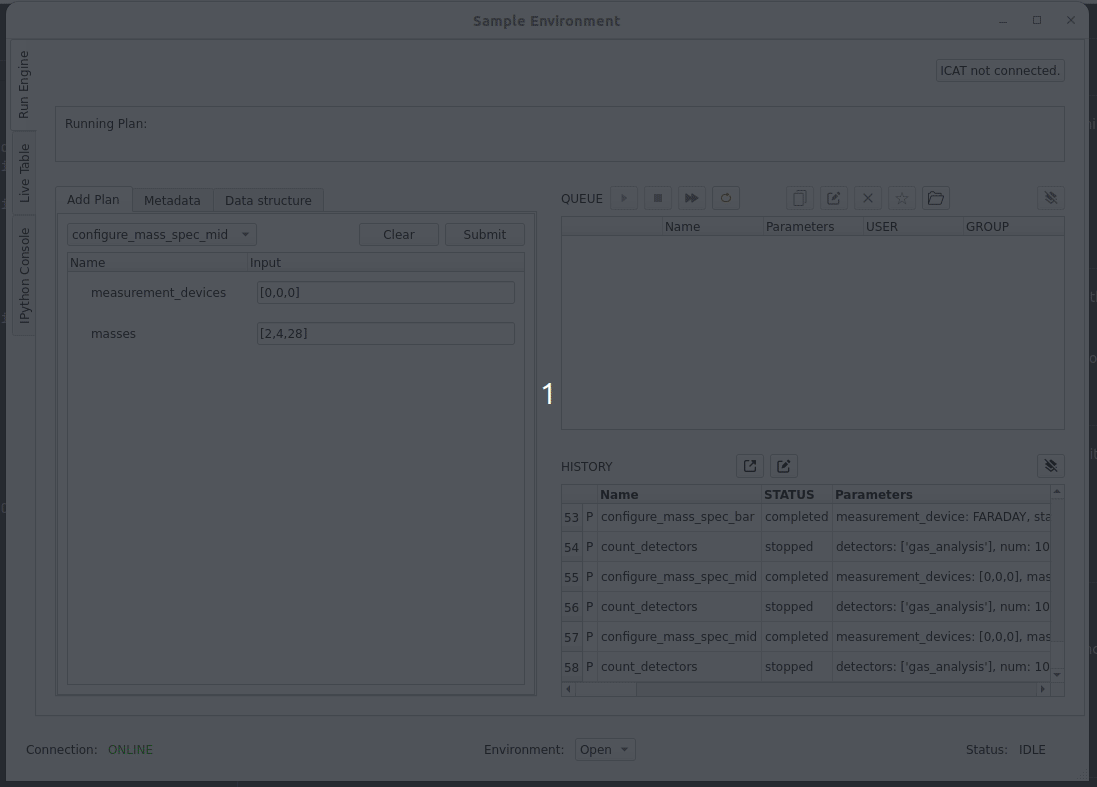
On the left side of the screen is a window that allows you to configure various plans. The drop down menu gives a list of all available plans.
You can enter the parameters you need, then press "Submit" the plan will then be added to the queue. You can keep pressing submit and it will be repeated.
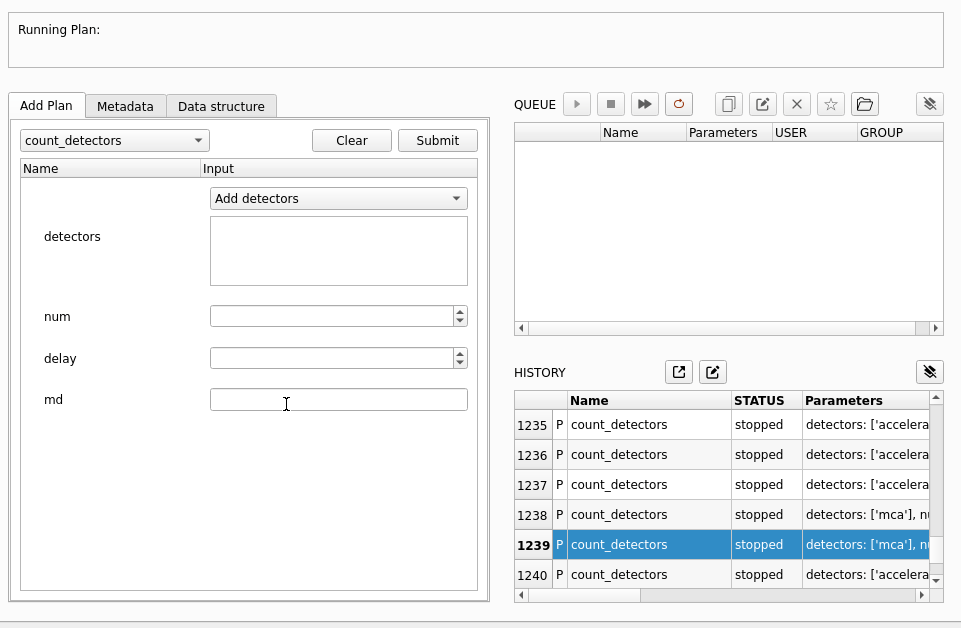
Controlling the Queue
There are a number of buttons at the top of the queue. Here is what each one does, in the order it appears.
| Name | Function | Enabled When |
|---|---|---|
| Play | Start the queue if it is not running, or resume a plan if it is paused | The environment is open and there is a plan in the queue or paused. |
| Pause | Pause a plan at the next possible moment if it is running. If a motor (e.g DCM) is moving, it will wait until the move is finished. For a long move (e.g. change from 9KeV to 18 KeV) this might take 12 mins. Please be patient, it's not just software | A plan is running |
| Stop | Request that the queue stops after the next plan has ended. | A plan is running |
| Skip | Pause the current plan, stop the RE, then move to the next item in the queue. | A plan is running |
| Loop | Request that the queue runs in loop mode. Plans that have finished executing will be returned to the back of the queue. It will keep looping until you stop the queue | A plan is running |
| Copy | Duplicate selected items in the queue | Always |
| Edit | Copy the contents of a selected plan to the plan editor and remove this item from the queue. Pressing submit again will put it back where it was. | Always |
| Delete | Remove a selected item from the queue | Always |
| Batch | Save the selected set of plans as a named batch | Always |
| Load | Load a batch of plans from a file | Always |
| Clear | Clear the plans from the queue | Always |
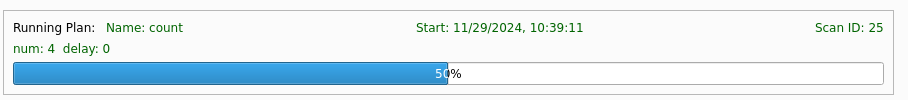
Monitoring the Running Plan
The box above the plan editor and the queue control widget allows you to monitor the currently running plan. The start time is shown along with the plan name and arguments.
Live Plotting
Data from each process (sample environment and beamline) is plotted seperately. Plotting for both is configured to run automatically. For reference, here are the names of the services which are doing the plotting:
| Desription | Service Name | Bash command to start |
|---|---|---|
| Plotting from the beamline process (e.g mca counts) | bluesky_plotting_callback |
bluesky_plotting_secondary |
| Plotting from the sample environment process (e.g temperature, pressure) | bluesky_se_liveplotting_callback |
bluesky_se_live_plotting |
Notepad GUI
So that it's possible to contstruct batches, another gui is provided which will not run plans. This is a notepad for you to work with while other measurements are running.
You can start this with:
bluesky_gui_notepad
Sample Environment Preview
Adding sample environment stage plans dwell, ramp and set_pressure to the queue is not easy to track what you have requested. As a helper we supply a command line utility to preview the temperature gas_system configuration that will be run, given a set of plans in the queue.
Please note This will only plot the plans in the notepad gui
To use this, add a set of sample environment plans to the primary (Sample Environment)queue and then open a terminal and run the command
se_preview
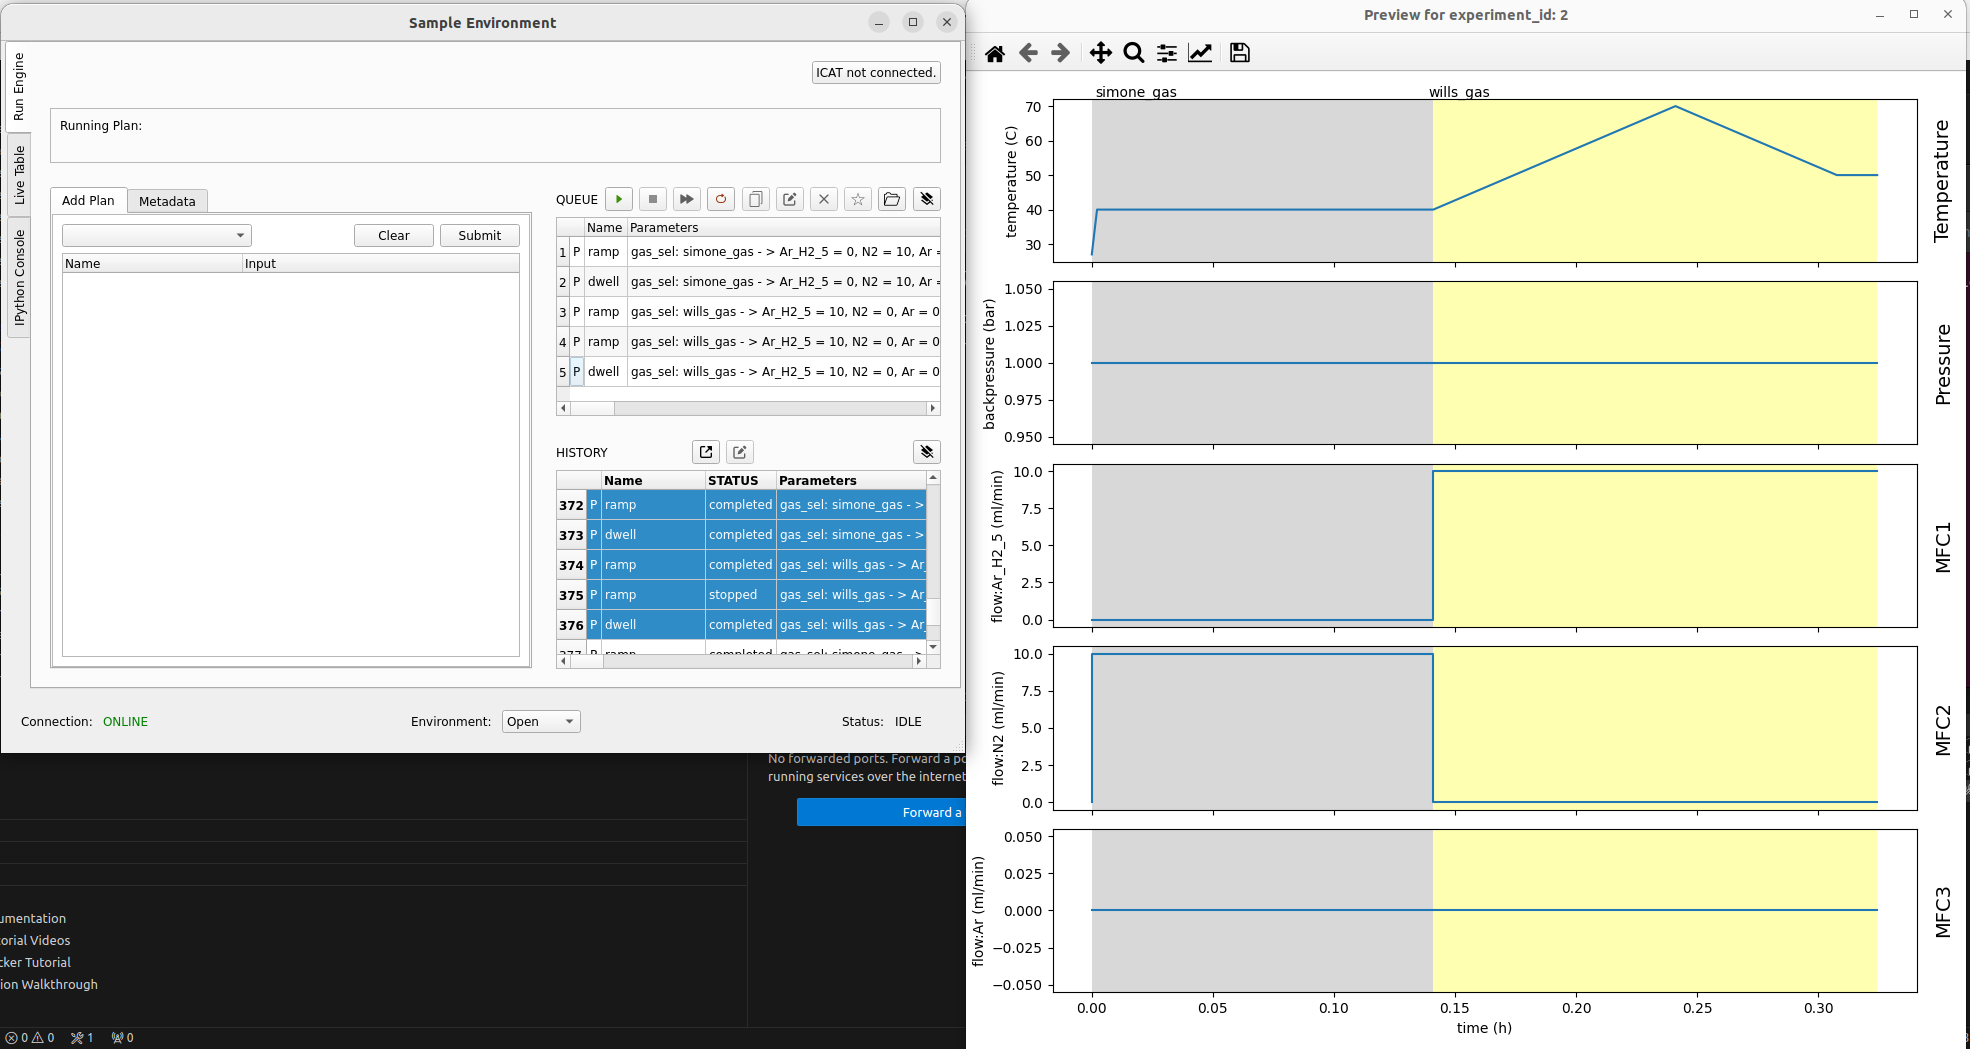
This command line tools runs a script at: /home/myspot/.bluesky-deployment/se_preview_plot It is written and maintained by Alexander. D
Jupyter Hub
There is a jupyter hub provided at http://evalc1e2s2x.exp0202.bessy.de/ For now this is only accessible inside the experiment network. There is a LAN cable provided if you need access to that from another machine.
The username is beamline_user the password is bluesky
Setup Of XRD
You will need to perform an initial measurement of the sample with the Eiger detector to determine the various parameters required for azimuthal integration.
- Insert your sample
- Make a new experiment datafile and call the dataset something meaningfull about doing the calibration. (See)
- Add an
switch_to_xrdplan to the queue in the Beamline Control UI - Add an
xrdplan to the queue. Setting the energy, exposure time and number of exposures accordingly. -
Run the measurement.
The data will be saved at the following location:
/mnt/eiger_nas/user/mySpot2/<YYYY-MM-DD_name_of_experiement>/<YYYY-MM-DD_name_of_dataset>/<YYYY-MM-DD_name_of_dataset>_<scan_id>_<uid>_<counter>.h5 -
open
pyFAI-calib2from the terminal. - Navigate to your data and perform the calibration to create the
.ponifile - copy that poni file to
/home/myspot/bluesky/data/poni
Plans
Sample Environment Plans
These plans form the stages of a catalysis sample environment experiment. Putting them together in a queue allows us to build an experiment.
set_pressure
This plan allows you to set the pressure of the gas system. While waiting for the pressure to be reached you can read the sample environment detectors at rate interval seconds.
ramp
Ramp the temperature at a given rate to a certain setpoint. Define a batch of plans to be sent to the secondary (beamline) queserver. While waiting for the temperature to be reached you can read the sample environment detectors at rate interval seconds
When this plan stops, it will stop the plan being run in the secondary queueserver.
dwell
Hold at a given temperature for a certain number of seconds. Define a batch of plans to be sent to the secondary (beamline) queserver. While waiting for the time to elapse you can read the sample environment detectors at rate interval seconds
When this plan stops, it will stop the plan being run in the secondary queueserver.
It is possible to define the number of times the plans in the secondary queueserver will loop for. If you set loop_num to 0 they will loop indefinitely. When they finish looping the sample environment will not stop until the dwell timer has run out
dwell_during
Like dwell, but rather than holding for a specific amount of time, it will hold at the specified gas mixture and temperature for as long as is required to perform the measurements.
This is useful when you want to ensure you perform e.g. 4 EXAFS measurements, no matter how long that takes.
Beamline Alignment Plans
align_sample_z
A 1 D relative scan of the sample Z
align_second_crystal_pitch
Scans the pitch of the DCM second crystal and moves the crystal to the maximum. Uses a fit from the bec
Assumes that the diode is in.
align_second_crystal_roll
Scans the roll of the DCM second crystal and moves the crystal to the maximum. Uses a fit from the bec
Assumes that the diode is in.
ascan_motors
Scan a motor over a range in absolute units. Read from a list of detectors.
Measurement Plans
It is critical that the switch_to_xrd or switch_to_xas plan is performed before doing xrd or xas. The detector could be damaged otherwise
When performing an alignment of the sample you also need to use the plan switch_to_xas
open_eiger
This plan will check if the check_eiger flag is set (environment reopened, switch_to_xas plan called), if it is, it will move the diode in and the beamstop in and out and check that the flux in the ionization chamber, and with and without the beamstop meets levels set in the bluesky environment by Ivo in the /beamlinetools/beamline_config/beamline.py file. These can also be set at run time.
beamline_parameters = {

    'beamstop_size':4,
    'beamstop_in_max_flux':10E7,
    'beamstop_out_min_flux':10E6,
    'ionization_min_flux':10E5
}
If anything is wrong, the fast shutters will close to protect the eiger.
switch_to_xrd
Sets a flag which will cause the next xrd plan to check that the beamline is correctly set up, that the beamstop is in the correct position and that enough light is reaching the detector. When everything has passed the beamstop is moved in and the diode is moved out.
Please Note the switch_to_xrd plan itslef will not cause the diode to move in or out, that will only happen when the next xrd plan is run.
switch_to_xas
Checks that the beamline is correctly set up for XAS and moves the diode in. Set's the flag to cause the next xrd to run open_eiger
select_absorber
Change the reference wheel to the required sample
xrd
Move the monochromator energy to the required energy
Trigger and read from the Eiger Detector N times
exafs
Perform an EXAFS measurement
xas_single_region
Perform an XAS measurement with a single region with linearly spaced points
xas_3_region
Perform an XAS measurement over three regions with linearly spaced points
Data
Data is saved in the mongoDB database. Additionally spec and csv files are saved as normal.
pyMCA
pymca is installed on the machine and is probably the easiest way of viewing historical data from an experiment. Remember you will need to navigate to your dataset and that it has a type that is not the default.
If it's not open you can start pymca by opening a terminal and running pymca or by pressing the icon in the start bar on the left.
Eiger Data
The eiger runs on an IOC in a container on the eiger ioc host machine. The RE tells it to save files from the detector to local storage at a specific file path.
This is specified with the eiger.file.write_path_template attribute.
An rsync script then pulls the data of the eiger storage every minute and then deletes it. The data is written to a NAS.
That NAS is then mounted on the bluesky host machine at /mnt/eiger_nas/user/mySpot2
From there it is mounted to the Tiled server container, specified in the bluesky_services docker-compose.
The configuration file for tiled specifies the handler to use to read the images from the Eiger HDF5 files.