Plot cff vs es
cff vs ExitSlit Position
A function to automatically fit a series of Nitrogen Spectra aquired at different cff and at different ExitSlit Position is available.
The prerequisite is to compile a list in the form of a yaml file with the:
- scan numbers
- exit slit position
- cff
The cff and exit slit position are necessary only if they are not saved in the baseline, or if the exit slit translation is not motorized.
The file must be saved in the folder ~/bluesky/data/cff_vs_exitSlit/input. The name is arbitrary but the extension must be .yaml.
The content of the yaml file has to follow a precise structure, including tabs and indentations. For instance, let us define the test.yaml file:
138:
  exit_slit_position: 0
  cff: 2.25
139:
  exit_slit_position: 20
  cff: 2.25
Once this is done, you can call the following function to perform the fit and plot the final graph:
cff_plot('test.yaml', save_path='mytest', n_peaks=6)
where the save_path is optional (if not defined, the results will be saved in the foder ~/bluesky/data/cff_vs_exitSlit/test), and n_peaks let you choose how many peaks using for the fit. Once a scan has been fitted the results are saved, and the next time you call the function it will not be fitted again.
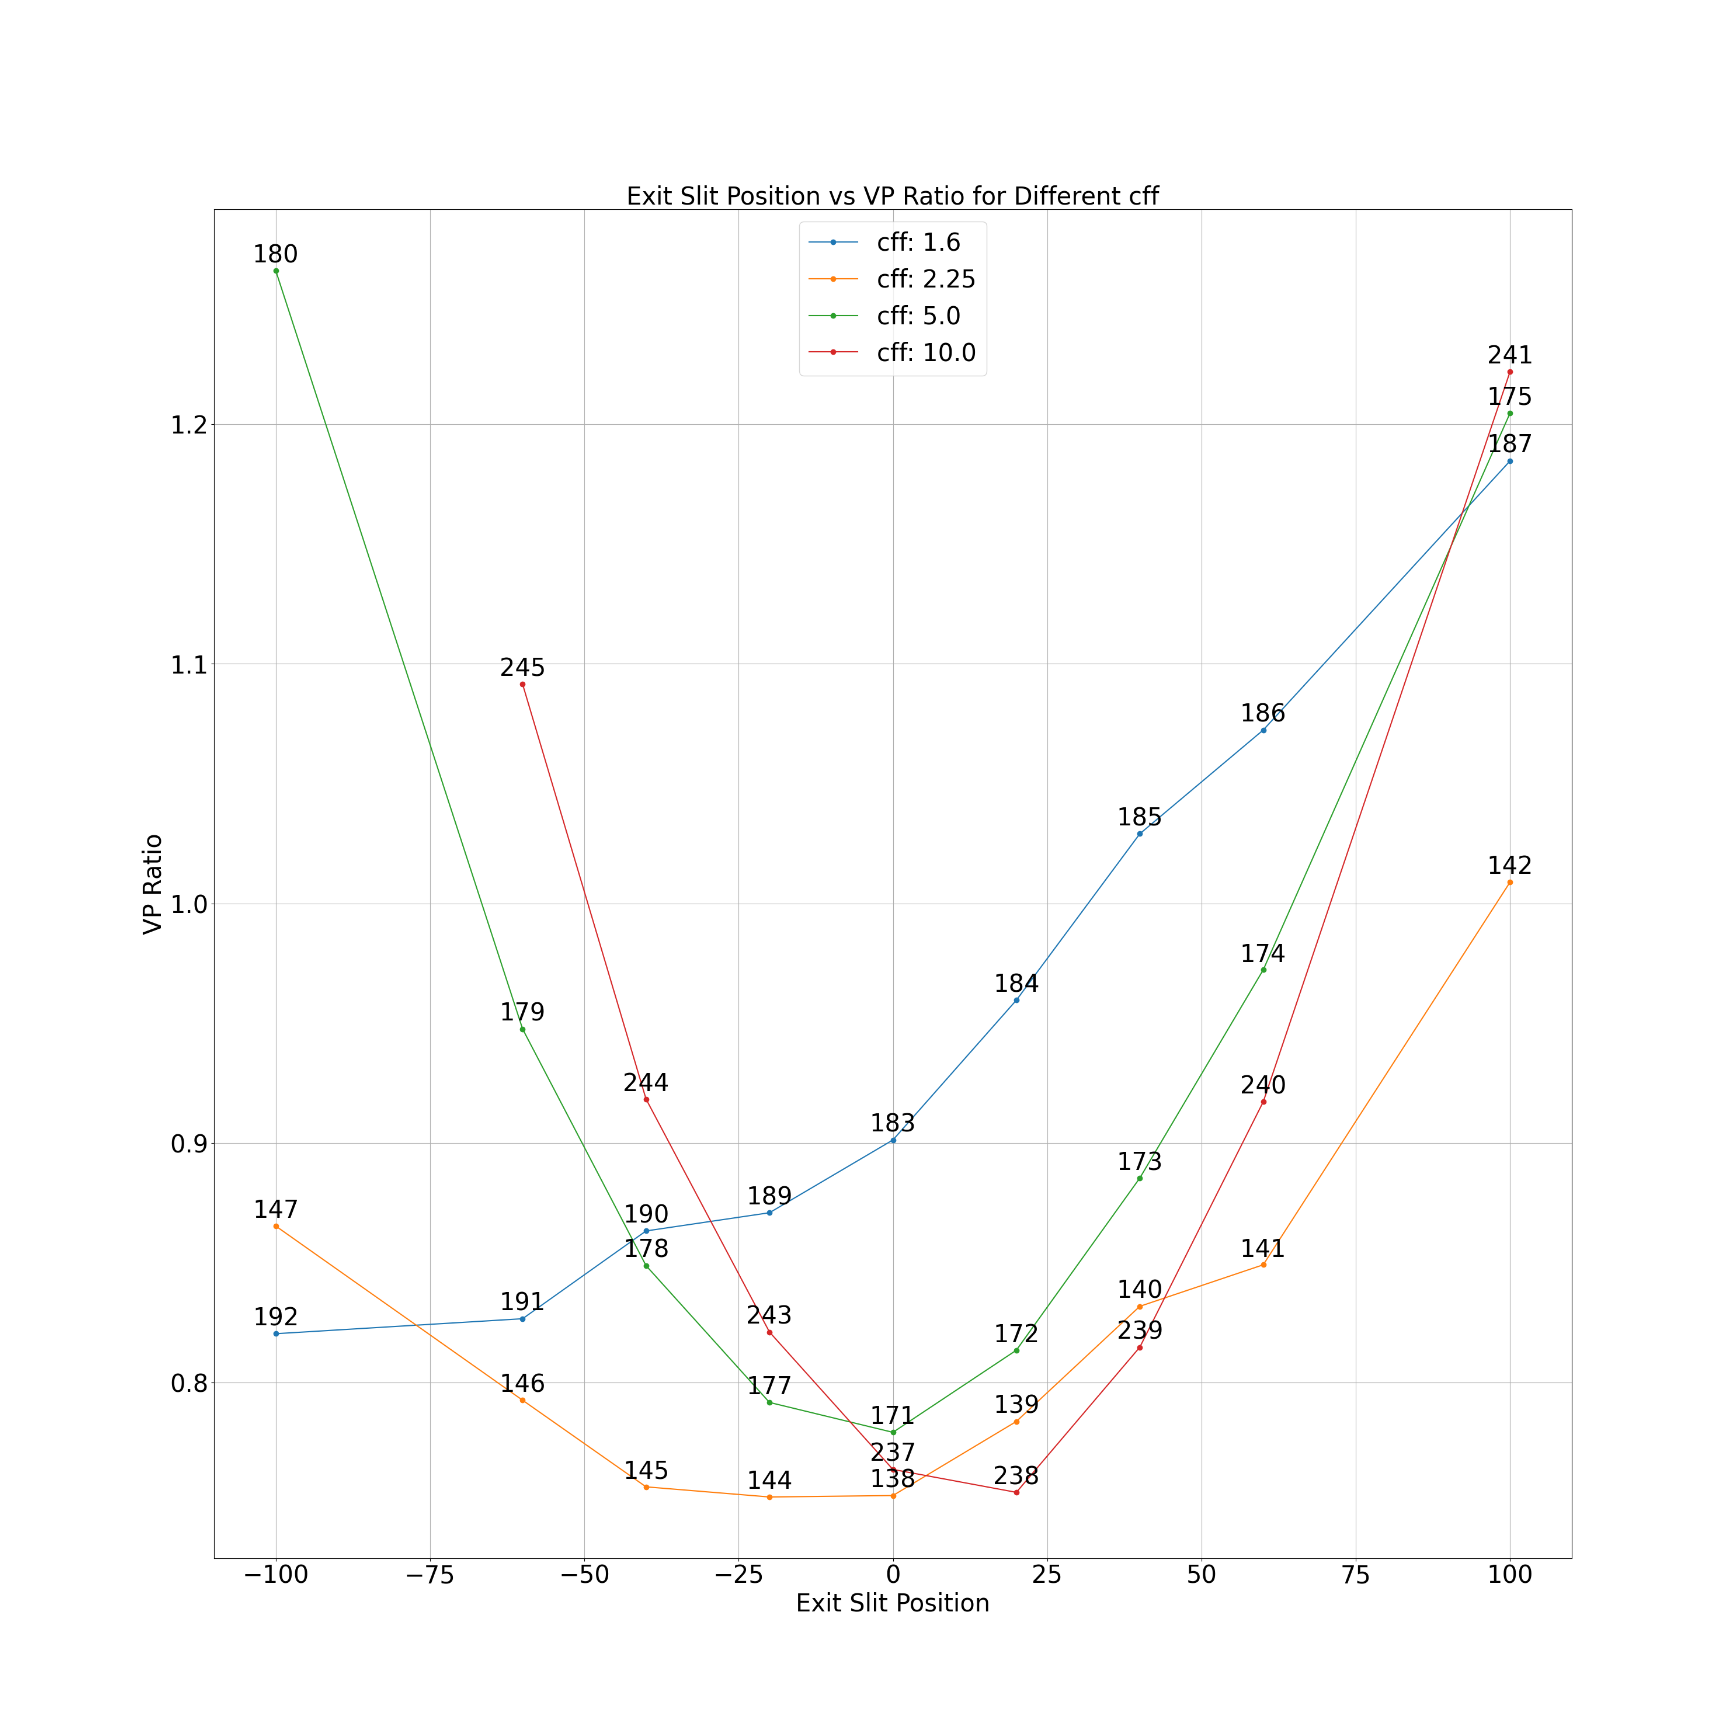
An example of the produced plot (the beamline was not aligned in this case):