SISSY1
This is the cookbook for using bluesky at the SISSY1 Experiment. Follow this guide in order to bring everything back if the machine is turned off.
This page is the homepage of firefox. If you need it again, just open firefox.
You can access these notes outside of HZB.
The Monitor
This endstation is part of a pair, SISSY1 and OAESE. The machine you are using shares the screen. There is a small button under the screen that allows you to switch between the two end stations.
Press the switch if you need to change end station machines. You should never need to do this, but it's worth knowing in case you press it by accident.
PREVAC Transfer and Pumping
The SISSY1 backbone is controlled by a piece of software called Rapid SE. You will use this to perform sample transfer and monitor various pressures. Also to move the manipulator in the end station. How to use this software is out of the scope of this documentation.
To open Rapid SE you can press the icon on the desktop in the top left.
Data
Data is saved on at /home/sissy_user/bluesky/data. In this directory data is saved as CSV and as spec files.
CSV data is saved under /home/sissy_user/bluesky/data/sissy1_2024/csv Each run creates a CSV file for primary and baseline plus a json dict of the metadata
Specfiles are saved under /home/sissy_user/bluesky/data/sissy1_2024.spec.
Starting PyMca
from a terminal write
pymca
or use the icon on the desktop
Start the Bluesky Service
from a terminal write
qserver_start
You must do this step before starting the GUI
Start Bluesky GUI
from a terminal write
bluesky_gui
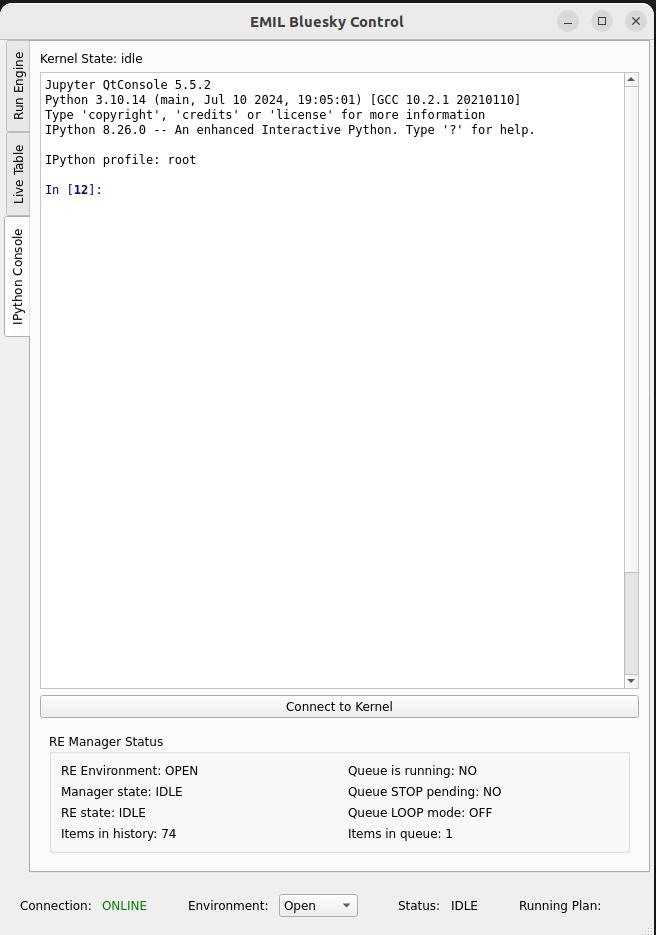
Connect GUI to the Bluesky Service
You must connect the GUI to the Bluesky Server.
Press the drop down menu which says "close", select "open"

After a short time (20 seconds) the display will look like this

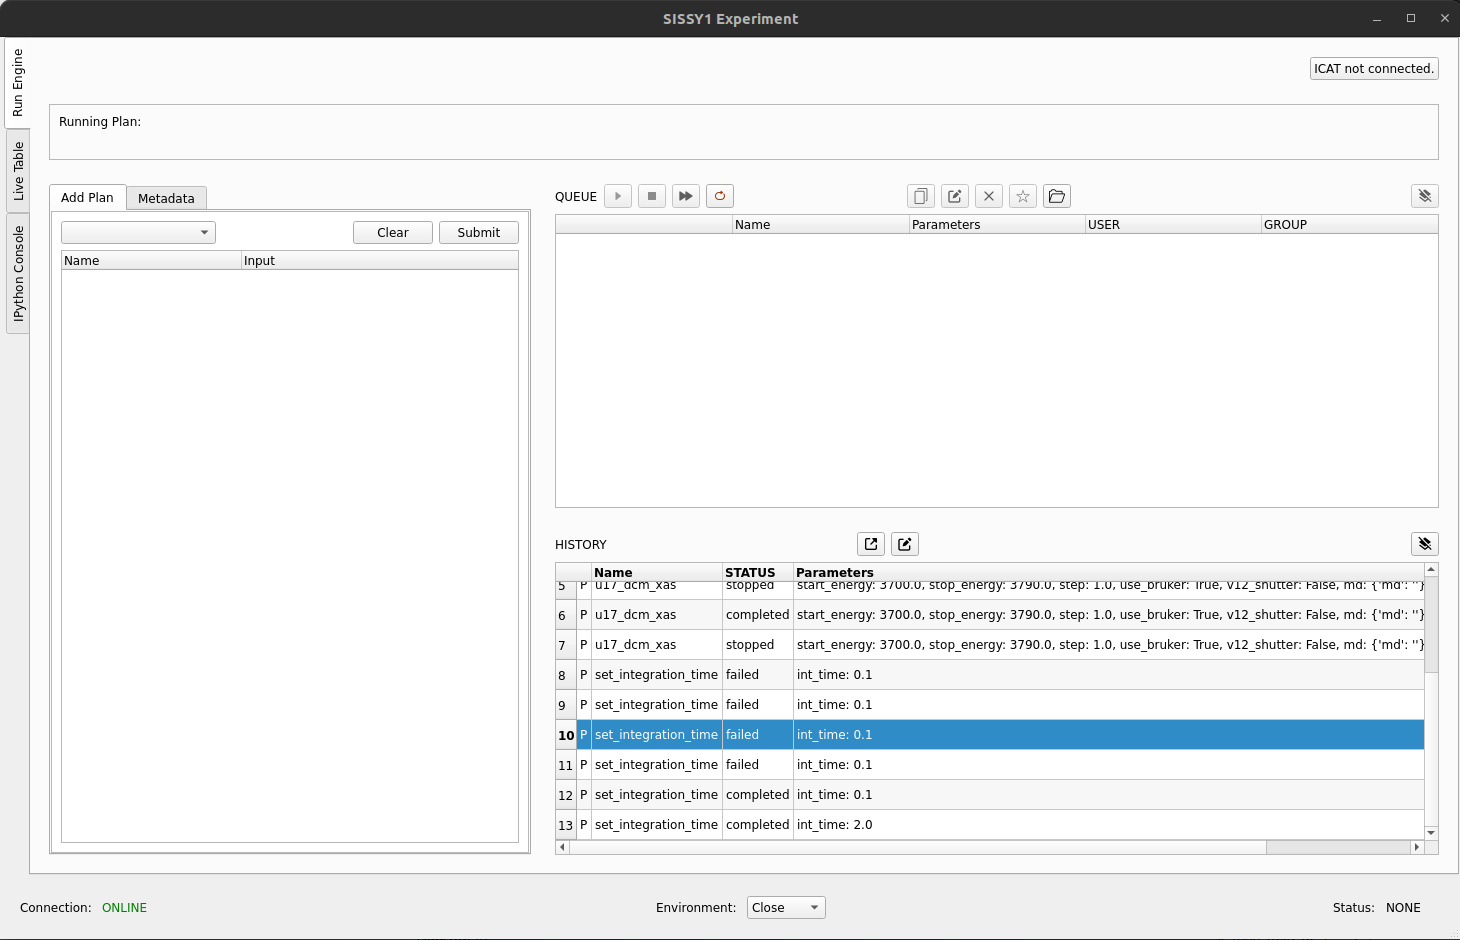
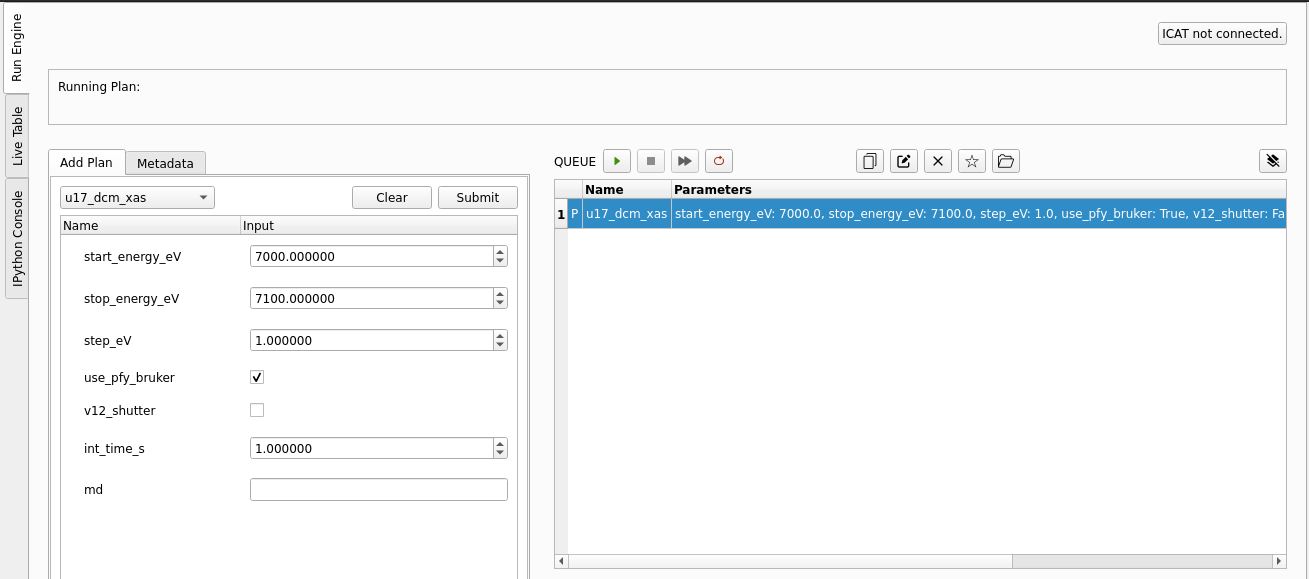
Running a plan
You can now add plans using the drop down menu from the top left. Press "Submit" to add them to the queue. Run them by pressing the green "play" button.
Hover over buttons to see what they do.
-
You can edit plans in the queue and reorder them.
-
You can make the queue loop forever.
You can copy plans.
You can create batches of plans by selecting a number of plans in the queue and pressing the "star" button. They can be loaded again with the "folder" icon
Note: when stopping or pausing a plan, be patient. Many motors and detectors are being stopped, some of them need to reach a safe state before they can do this.
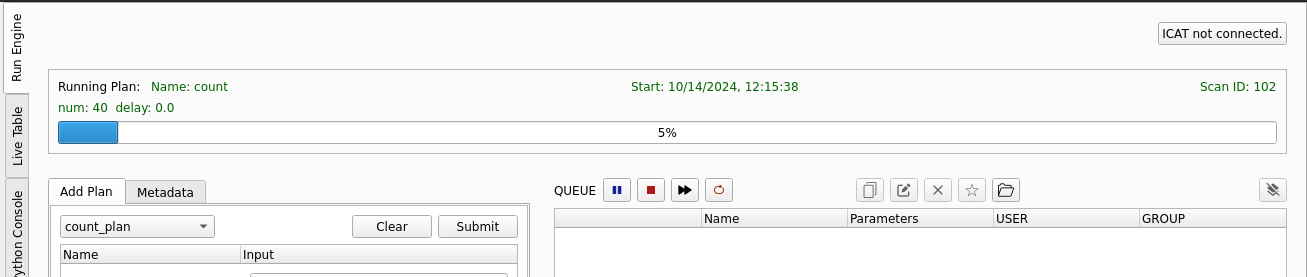
When a plan is running it will be removed from the queue and will appear at the top of the screen. Where relevant, a progress bar will be shown.
Connecting to the IPython Kernel
Once the GUI is connected to the qserver you can connect to the IPython Kernel. This is useful if you need to interact directly with the Bluesky environment. (See later)
Press the button "connect to Kernel"
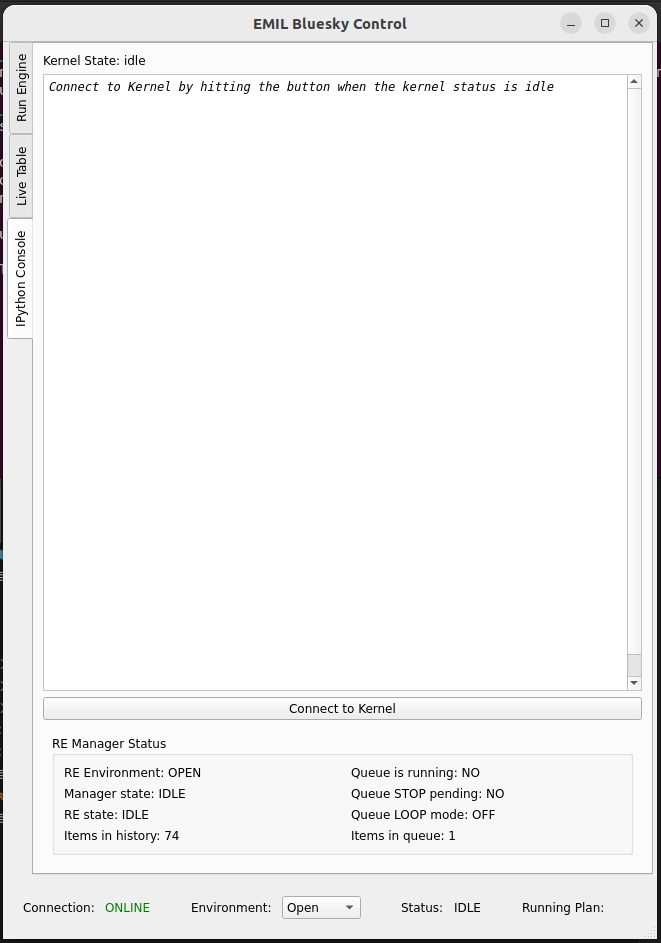
It will look like this when connected:
Viewing the RunEngine Terminal
The Queserver allows us to submit plans to the RunEngine. Currently the best way of monitoring this is from a terminal
open a terminal and type
bluesky_monitor
You will see the logs of the queueserver
Devices
When including devices in the detector list you can choose from the following
| Name | Description |
|---|---|
i0_mirror_current_u17 |
kth25 connected to M4 UE48 |
i0_mirror_current_ue48 |
kth20 connected to M4 UE48 |
pfy_bruker_mca |
Bruker Multi Channel Analyser |
u17_dcm.en |
u17 DCM |
ue48_pgm.en |
UE48 PGM |
Whatch out, there is a bug.... when using a count plan, selecting pfy_bruker will not work you must use pfy_bruker_mca
Starting Phoebus Beamline Panles
From a terminal write
phoebus_start
This will open all of the phoebus panels for the beamline.
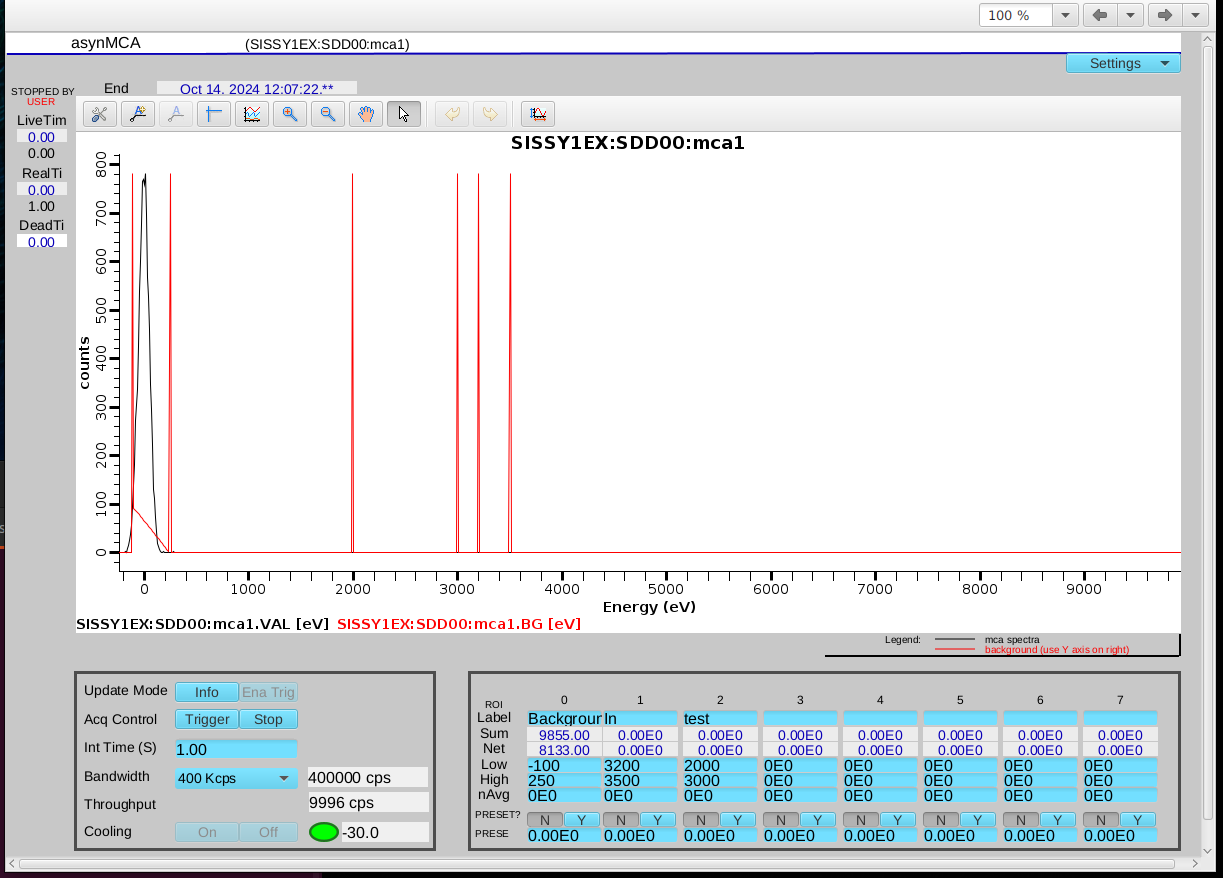
The Bruker SDD
pfy_bruker_mca
The Bruker Silicon Drift Detector (SDD) is a detector which allows us to perform PFY measurements. It is known as an MCA (Multi Channel Analyser)
You can name regions of interest and define their start and stop energies in the phobeus panel.
Bruker Config and Triggering
Cooling should be on when operating. Turn it off at the end of your experiment. The nominal operating temperature is -30.
Bandwidth of the device should be set high enough that the Throughput doesn't approach it. Operating around 80% is ok. Move to the white line of the edge you are going to scan over while in Update Mode "Info" and check that the Counts Per Second (CPS) is not too high. If it is, reduce the intensity of the beam or move the Bruker detector further away from the sample.
If you want to manually trigger the device you have ot set Update Mode "Ena Trig". This will stop updating the values of Throughput and the temperature readout, but is required to read the spectrum.
When running a scan with bluesky the program will automatically do this for you and put it back at the end.
Configuuring Bruker ROI Output Plotting
To change what is plotted live enter in the IPython Kernel
pfy_bruker_mca.roi0.display()
or
pfy_bruker_mca.roi0.hide()
Current Monitoring
There are various currents measured with Keithley Electrometers of different types.
You can set the integration time on most Keithleys in ms. The U17 Keithley integration time is set in NPLC (number of Power Line Cycles. Each NPLC is 20ms)
Plans
set_integration_time
This plan will set the integration time of all detectors.
Keithleys cannot have an integration time higher than 200ms
rel_move
Move a motor relative to it's current position. Wait for it to complete
move
Move a motor to a new absolute position. Wait for it to complete, or not.
open_v12 and close_v12
open and close valve 12
sleep
sleep and do nothing for a given number of seconds
u17_dcm_xas
scan the U17 branch DCM energy with a linear step size in eV. You can set the integration time of the detectors.
ue48_pgm_xas
scan the UE48 branch PGM energy with a linear step size in eV. You can set the integration time of the detectors.
ue48_pgm_flyxas
scan the UE48 branch PGM energy continuously. Measure from detectors as fast as possible given the integration time of the detectors. Energy step size is a function of the integration time and the energy velocity.
XPS Analyser
Startup Instructions
- Power on the windows machine under the desk labelled 'SISSY1 PEAK PC'
- Ensure that the HV is powered on and connected
- Ensure that the camera is powered on and connected
- On this windows machine, Press the icon on the desktop named 'Start PEAK-1.6.0'
- From the task tray, right click on the orange PEAK icon, press 'Start'
- Once illuminated you can right click again and press 'Start PEAK GUI'. This will take you to
http://127.0.0.1:8087/ - Press "Start PEAK Servers"
- When prompted to verify HV connections, verify then press "OK"
- You can then press the green "Play" buttons to start the three remaining servers (Electronics, Camera and Analyser)
- Press the two cogs at the top right of the screen, this displays information about the system.
- You have now started PEAK
Starting the IOC for monitoring counts
- On the SISSY1 Endstation machine "sissy-es02" start, or restart, the container named
peak_cam